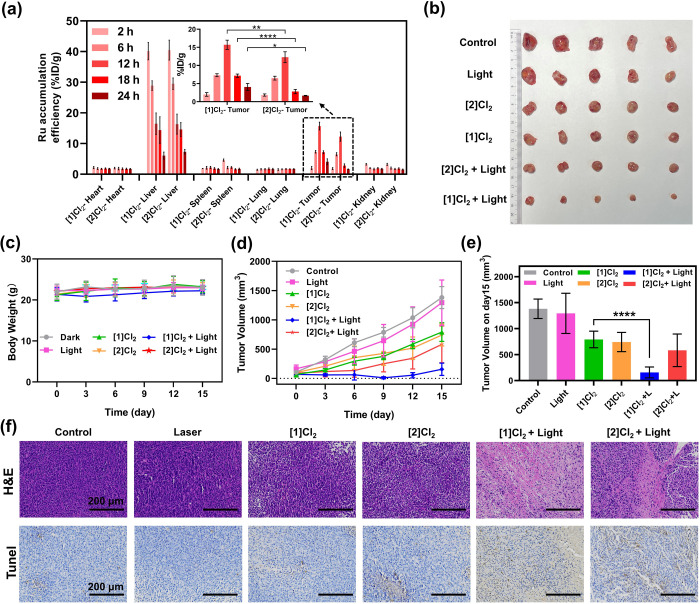
Figure 6.
Antitumor effect in vivo. (a) Biodistribution of Ru content (% ID/g, n = 3) in major organs of mice at different time points following intravenous injection of [1]Cl2 (7.7 mg/kg) or [2]Cl2 (5 mg/kg). % ID/g = Ru content (μg)/tissue (g) compared to total injection of Ru (μg) determined by ICP-OES. Inset: Ru content in the tumor tissue. (b) Photographs of the tumor captured on day 15 for mice treated with phosphate-buffered saline (PBS), light, [1]Cl2, [2]Cl2, [1]Cl2 + light, or [2]Cl2 + light. Body weight (c) and tumor volume (d) of mice following time evolution after treatments for 15 days, n = 5. (e) Tumor volume of mice on day 15 from Figure 6d, n = 5. (f) H&E and TUNEL stained images of tumor slices after different treatments on day 7. All of the errors in Figure 6 represent the standard deviation (SD); two-way analysis of variance (ANOVA) was used to determine the significance of the comparisons of data (*P < 0.05; **P < 0.01; ****P < 0.0001).

