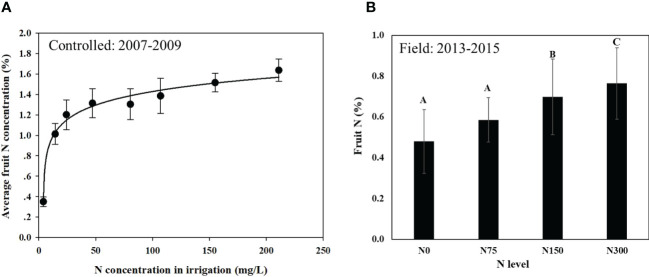
Figure 1.
Average fruit N concentration in response to N application rate in the controlled experiment (A) and in the field experiment (B). Data for the controlled experiment represent averages of three fruit-years with 6 replicates in the first year and 3 replicates in the following years (n=12) with a fitted logarithmic regression curve (R2 = 0.98; p<0.0001). Data for the field experiment are averages of the last three fruit-years (2013-2015) for14 replicates (n=42). Linear regression was fitted (fruit N = 0.512 + 0.0009181*N level), R2 = 0.90; p<0.05. Values labeled with different letters are significantly different following Tukey HSD test. * Is the regressions' equation.

