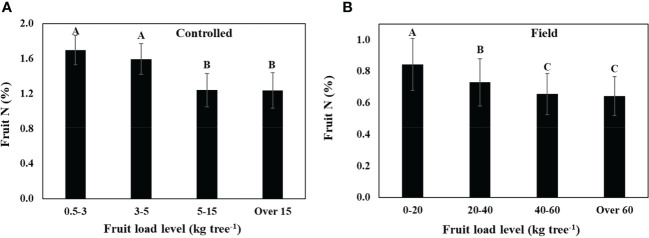
Figure 2.
The effect of fruit load on fruit N concentration regardless of N nutritional level, (A) in young olive trees grown in large containers (controlled), and (B) in field-grown trees. Each category is an average of data collected during 2007-2009 in the controlled experiment (a, n=108), and 2011-2015 in the field experiment (b, n=126). Values labeled with different letters are significantly different following Tukey HSD test.

