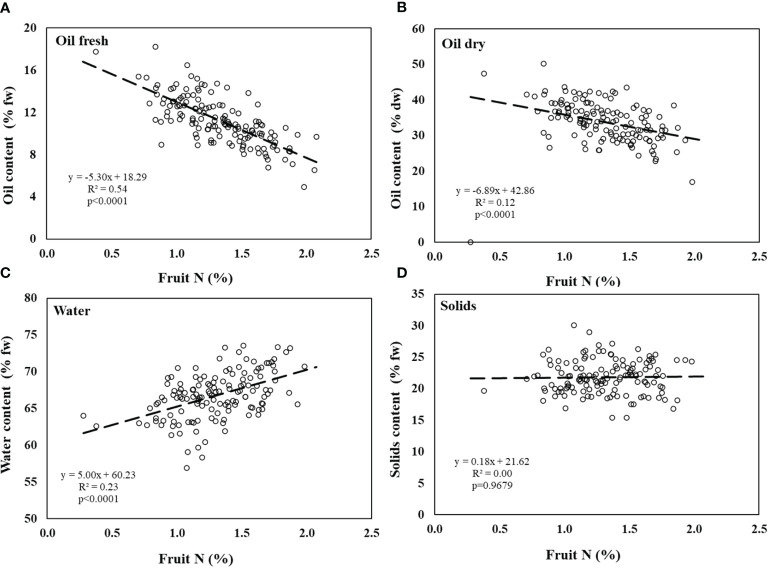
Figure 3.
Olive fruit composition in the controlled experiment. (A) % oil by fresh weight, (B) % oil by dry weight, (C) water content, and (D) solids content as a function of fruit N concentration. Linear regressions of oil content (fresh), oil content (dry) and fruit water content are significant (p<0.0001). Solids content are not significantly affected by fruit N. Each symbol represents an individual tree at a given fruit year (2007-2009, n=96).

