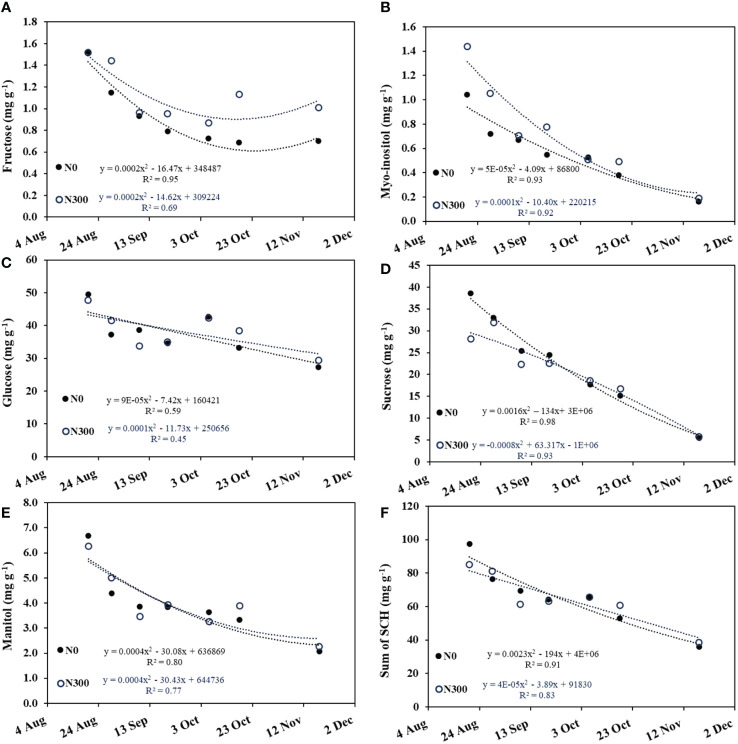
Figure 8.
Changes in major soluble carbohydrate (SCH) concentrations in the fruit during the oil accumulation period (Aug. 20 to Nov. 18, 2015) at the two extreme N fertilization levels: N0 (filled circles) and N300 (open circles) in the field experiment. (A) fructose, (B) Myo-inositol, (C) glucose, (D) sucrose, (E) mannitol, and (F) sum of all major carbohydrates. Each datapoint is an average of 5-8 repetitions. Best fit regression (linear or quadric) is presented.

