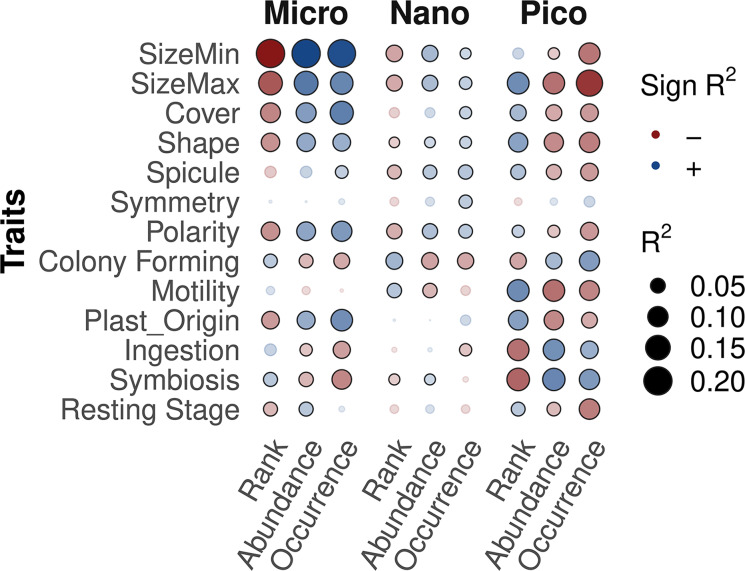
Fig. 5.
Correlation between OTUs’ traits and their rank in rank abundance curves, total abundance and occurrence across the samples of each size-fraction. Categorical traits were ordered by investment in complexity (details of this ordering can be found in [24]). Correlation was investigated using Spearman’s coefficient, the sign and value of the R2 are represented by the color, color intensity, and the size of the bubbles, significant correlations (p.value < 0.05) are circled in black. This analysis could be sensitive to OTUs cross-contamination between size-fractions, OTUs were thus sorted into the size-fraction in which they were the most abundant and excluded from the others

