Fig. 3.
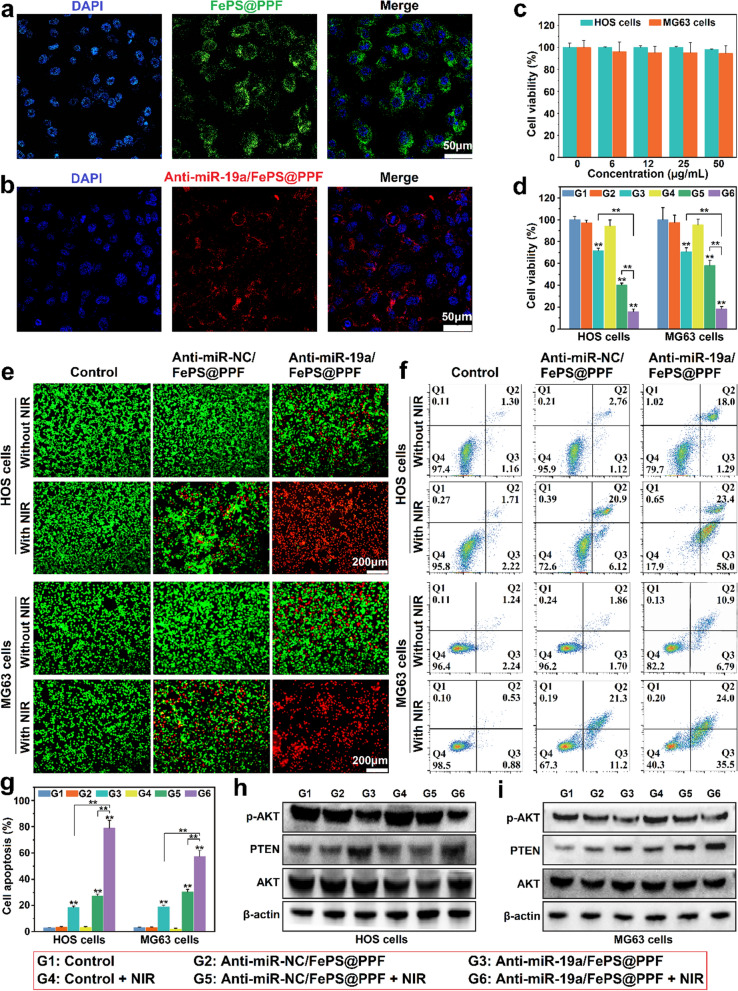
In vitro anti-tumor effect of anti-miRNA/FePS@PPF. a Images of HOS cells treated with FITC-labeled FePS@PPF and b Cy5.5-anti-miR-19a/FePS@PPF for 6 h (scale bar is 50 μm) obtained from confocal microscope. c Relative cell viabilities after incubation with FePS@PPF with various concentrations at 48 h. d Relative cell viability in the group of PBS (Control), anti-miR-NC/FePS@PPF and anti-miR-19a/FePS@PPF with or without NIR (FePS@PPF concentration of 25 µg/mL). e Fluorescence live (green)/dead (red) images (scale bar is 200 μm). f Flow cytometry analysis of apoptotic/necrotic cells and g the statistics of relative percentage of tumor cell apoptosis. h, i Western blot analysis of PTEN, AKT and p-AKT expression after different treatments for 48 h. **p < 0.01, G3, G5 and G6 compared to Control (G1)

