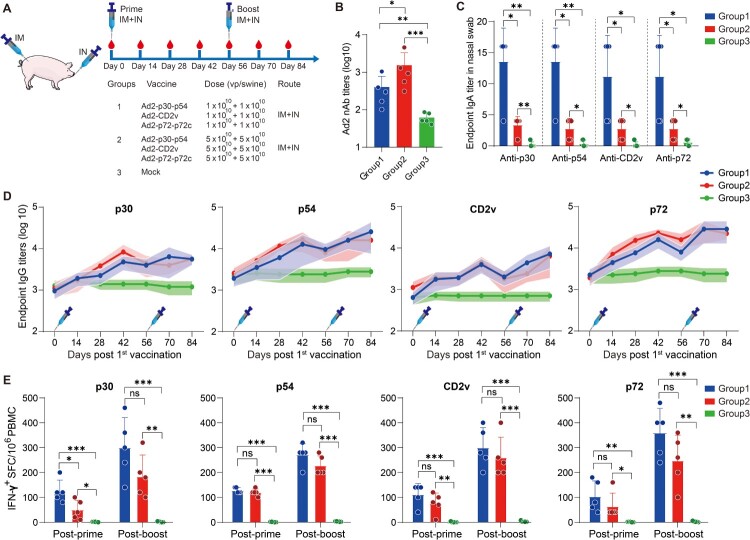
Figure 6.
The systemic and mucosal antibody and T-cell immune responses to ASFV antigens after prime-boost vaccination via IM + IN administration in swine. (A) Schematic of the prime-boost vaccination scheme in swine. Swine received a second dose of the same vaccine 56 days later. The red blood drop symbols indicate the time points when blood samples and PBMCs were collected. (B) The nAb titres against Ad2 in different vaccination groups. (C) ELISA was used to assess IgA antibodies against the p30, p54, CD2v, and p72 proteins in nasal swabs. (D) The IgG antibodies to p30, p54, CD2v, and p72 at the indicated time points postvaccination were assessed by ELISA. (E) IFN-γ ELISpot was used to detect the number of antigen-specific IFN-γ-secreting cells per million PBMCs in swine. The data represent the results of three independent experiments. Comparisons using the student’s t test. *, p < 0.05; **, p < 0.01; ***, p < 0.001.

