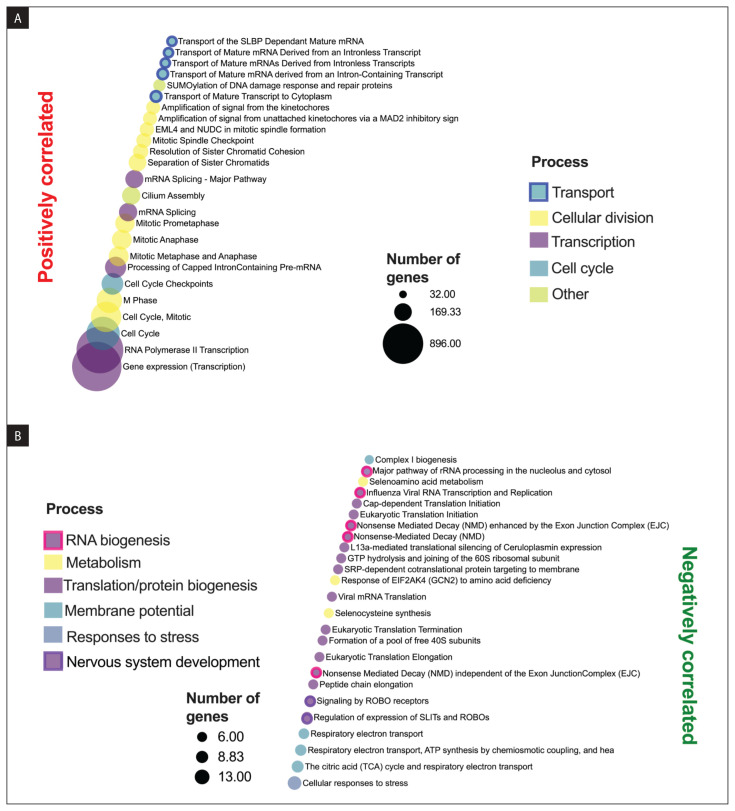
Figure 3.
Genes correlated with RPL23AP53: positive (> 0.3) (A) and negative (< −0.3) (B) Pearson correlations of RPL23AP53 gene with genes and analyzed using REACTOME pathway analysis for distinguishing cellular pathways and processes. Only results with p < 0.05 and false discovery rate (FDR) < 0.05 were shown

