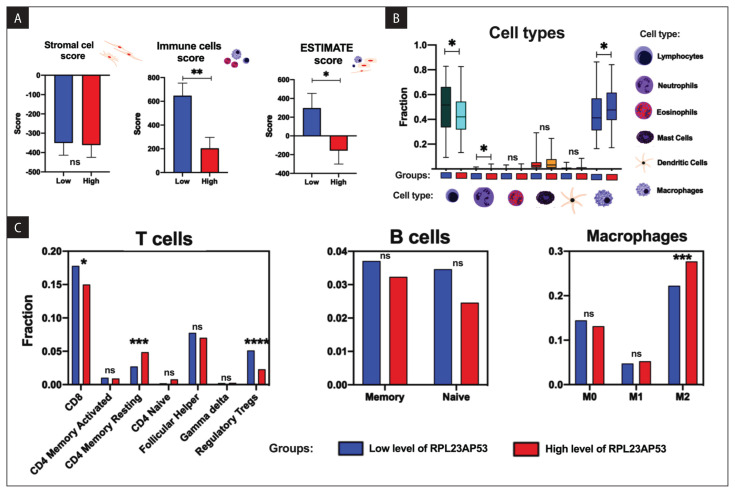
Figure 5.
Association of the immunological profile of the Cancer Genome Atlas (TCGA) melanoma patients with the expression levels of RPL23AP53: A. ESTIMATE, immune cells, and stromal cells scores; B. differences of lymphocytes, neutrophils, eosinophils, mast cells, dendritic cells, and macrophages; C. The fraction of specific subpopulation of T cells, B cells, and macrophages depending on the low and high expression levels of RPL23AP53; T-test or Mann Whitney test, p < 0.05 considered as significant; ns — non significant; *p < 0.05, **p ≤ 0.01, ***p ≤ 0.001, ****p ≤ 0.0001

