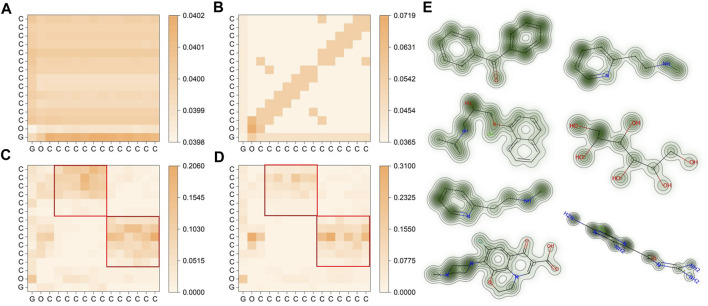
FIGURE 3.
Visualization of molecular representations for benzophenone in SMG-BERT with varying degrees of features. (A) Only 1D information is considered. (B) 1D + 2D information is considered. (C) 1D+ 2D+ 3D geometric information is considered. (D) 1D + 2D + 3D + chemical information is considered. The red squares are the positions of the two benzene rings. (E) Attention maps for (left column, from top to bottom) benzophenone, propranolol, betahistine, ofloxacin, betahistine, hexitol, and amiloride. Greener areas represent higher weight values.

