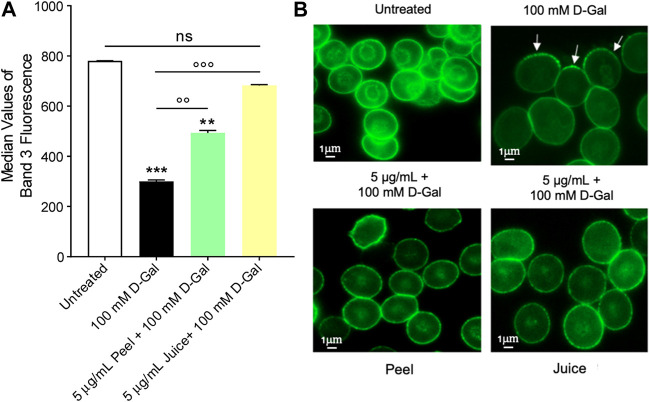
FIGURE 2.
Flow cytometry immunofluorescence of band 3 expression. Red blood cells were left untreated or treated with 100 mM D-Gal for 24 h at 25°C, with or without pre-exposure to 5 μg/mL peel or juice extract for 15 min at 37°C. (A) Histograms report median values of fluorescence intensity. (B) Flow cytometry immunofluorescence representative micrographs showing band 3 distribution in left untreated RBCs, treated with 100 D-Gal, or alternatively, pre-incubated with 5 μg/mL peel or juice extract, and then exposed to 100 mM D-Gal. Samples were observed with a ×100 objective. Note the significant morphological changes in 100 mM D-Gal (arrows). ns, not statistically significant versus control (untreated); **p < 0.01 and ***p < 0.001 versus control, ◦◦ p < 0.01 and ◦◦◦ p < 0.001 versus 100 mM D-Gal, ANOVA followed by Bonferroni’s multiple comparison post-test (n = 3).

