
Extended Data Figure 12: Mitochondrial localization of NS3 is essential for inducing cell death and norovirus infection.
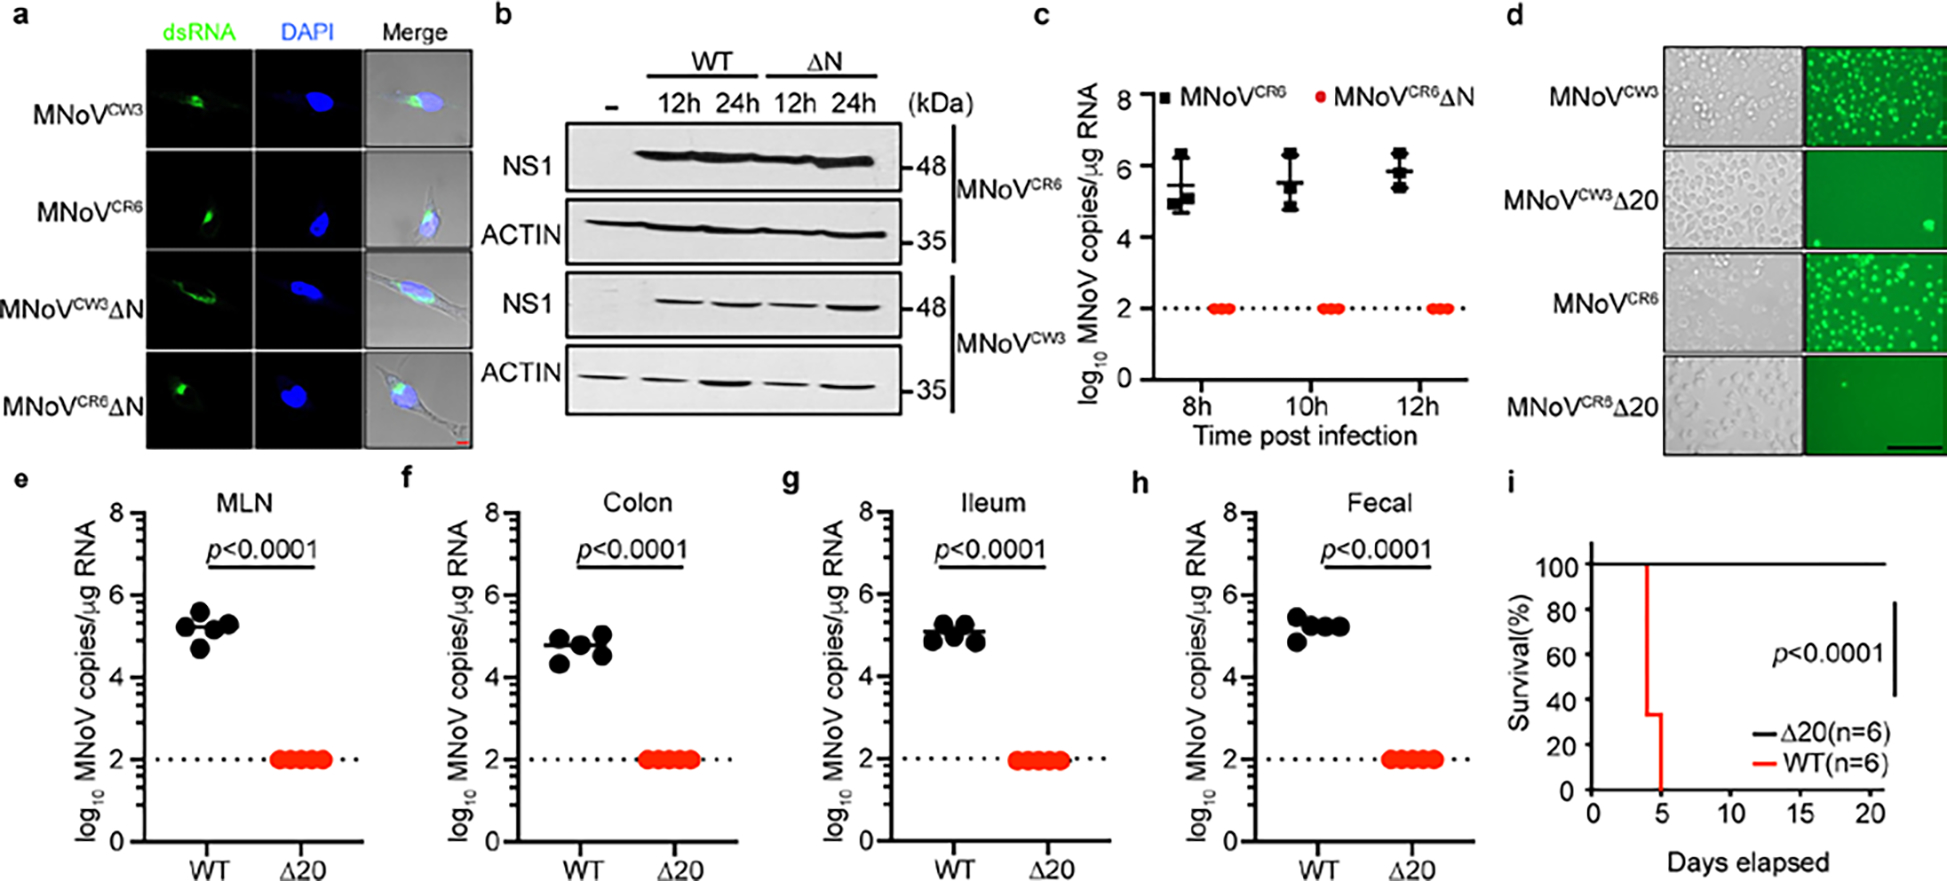
a, Representative confocal microscopy images of staining for dsRNA (green) and DAPI (blue) in BMDMs infected with WT (MNoVCW3and MNoVCR6) or mutant (MNoVCW3ΔN and MNoVCR6ΔN) virus at MOI of 5 for 12 h. Scale bar, 5μm. b, BMDMs derived from wild-type mice were infected with WT (MNoVCW3and MNoVCR6) or mutant (MNoVCW3ΔN and MNoVCR6ΔN) viruses. Cells collected at indicated time points and total cell lysates were subjected to anti-NS1 or anti-actin immunoblotting. c, BV2 cells infected with WT (MNoVCR6) and mutant (MNoVCR6ΔN) MNoV at MOI=1 and viral genomes that were in the supernatant were quantified by qPCR. N=8 for all groups. d, Representative images of Sytox-Green-stained BV2 cells infected with WT (MNoVCR6 and MNoVCW3) and mutant (MNoVCR6ΔN20 and MNoVCW3ΔN20). Scale bar, 100μm. (e-h) WT mice were challenged with 106 PFU of MNoVCR6 or MNoVCR6ΔN20 perorally. All mice survived infection. Viral genomes were quantified in the (e) MLN, (f) colon, (g) ileum, (h) feces at 7 days post infection. N=5 for both groups. Dashed line represents the limit of detection. (i) Survival of Stat1−/− mice after challenge with 106 PFU of MNoVCW3 (n=6) and MNoVCW3ΔN20 (n=6). Data in (a, b and d) are representative of two independent experiments. Data in (c) represents three independent experiments. Data are presented as mean ± s.d. Data in (e-h) pooled from two independent experiments. Statistical analysis was conducted using Mann-Whitney test. P-value for (i) was calculated with a log-rank (Mantel-Cox) test.