Figure 1.

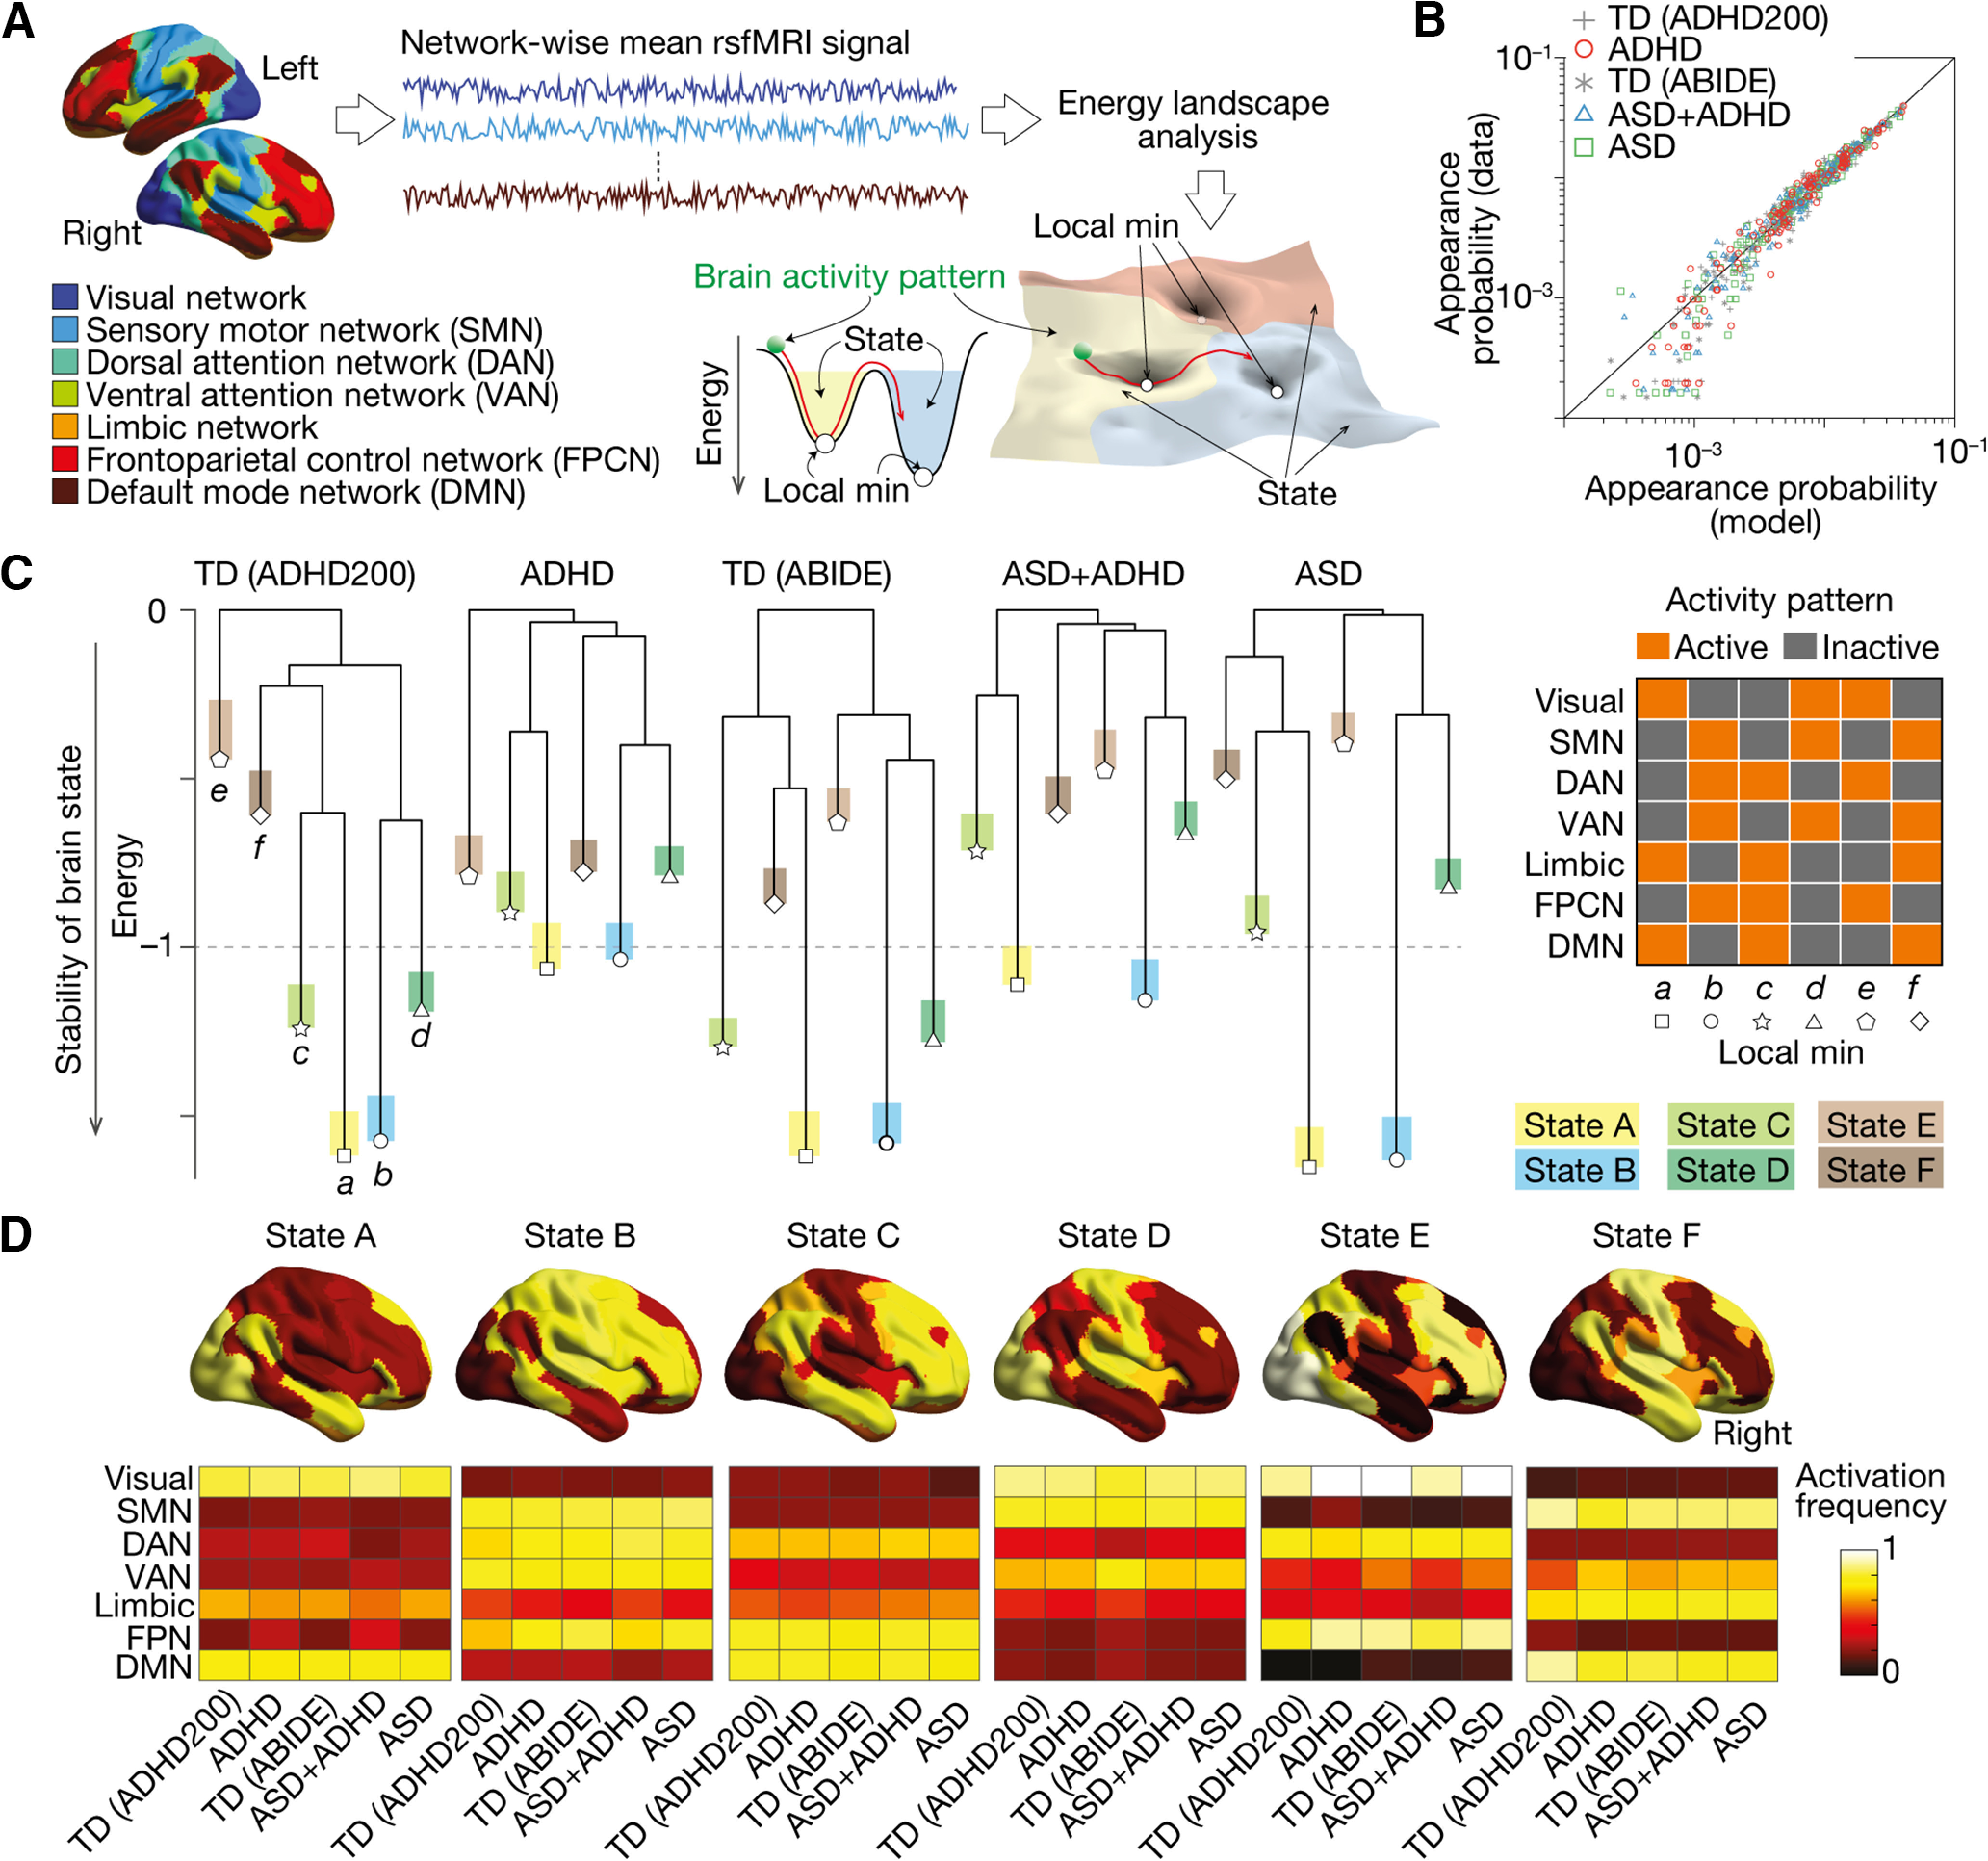
Six brain states determining global neural dynamics. A, We performed energy landscape analysis to examine the global neural dynamics. After parcellating the brain into seven functionally distinct networks, we fitted a pairwise maximum entropy model (MEM) to the network-wise rsfMRI signals and identified the structure of the energy landscape for each group. In the energy landscape, local minima represented the most stable brain activity patterns in their neighboring areas, and basins (attractors) indicate the sets of the brain activity patterns that can be summarized into the corresponding local minimum. B, The pairwise MEM was accurately fitted to the rsfMRI data in all the participant groups (>97.5%). C, The dendrograms, so-called disconnectivity graphs, show the structures of the energy landscapes. All the participant groups shared the same six local minima (local min a–f), whose activity patterns were displayed in the right panel. D, The six brain states (States A–F) corresponding to the six local minima were similar between the five participant groups (r > 0.91). TD, typically developing. ADHD, attention-deficit/hyperactivity disorder. ASD, autism spectrum disorder. ASD+ADHD, a comorbid condition of ASD and ADHD. TD (ADHD200), TD data stored in the ADHD200 project. TD (ABIDE), TD data stored in ABIDE project.
