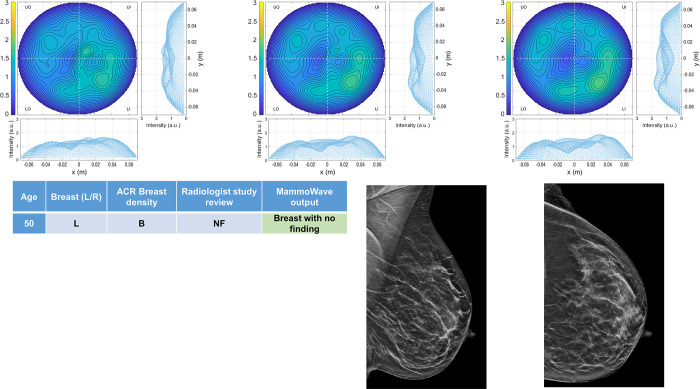
Fig 3. Example of NF breast: 50 years old woman, mammographic low-density (ACR B), left breast (DBT and ultrasonography BI-RADS 1).
Microwave images, normalized to unitary average of the intensity, are given in the top row for three different conductivity weightings (from left to right: 0.3 S/m, 0.4 S/m and 0.5 S/m, respectively). Microwave images are given here as 2D images in the azimuthal, i.e., coronal plane. Moreover, 1D intensity projection on X and Y is displayed in the inserts. X and Y are given in meters; intensity is in arbitrary units. The proposed rule-of-thumb classifies this breast as negative (the values of the microwave images’ selected features are provided in the S1B Table).

