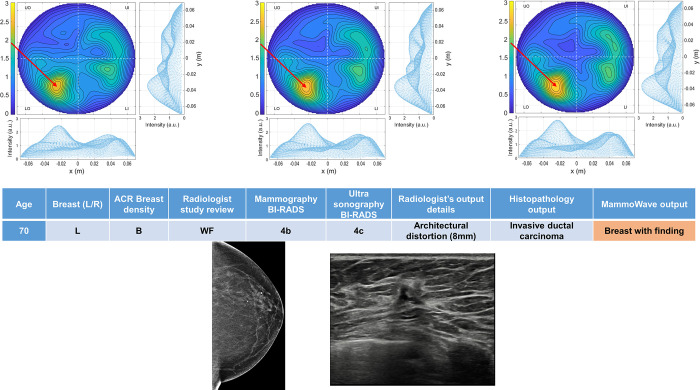
Fig 6. Example of WF breast: Mammographic low density (ACR B) left breast of 70 years old woman with a mammographic parenchymal distortion of 8 mm confirmed by DBT in the lower outer quadrant.
Histopathology output is also given in the insert. Microwave images, normalized to unitary average of the intensity, are given in the top row for three different conductivity weightings (from left to right: 0.3 S/m, 0.4 S/m and 0.5 S/m, respectively). Microwave images are given here as 2D images in the azimuthal, i.e., coronal plane. Moreover, 1D intensity projection on X and Y is displayed in the inserts. X and Y are given in meters; intensity is in arbitrary units. All microwave images show a non-homogeneous behavior, with a main peak indicated by the red arrows. The proposed rule-of-thumb classifies this breast as positive (the values of the microwave images’ selected features are provided in the S1B Table).

