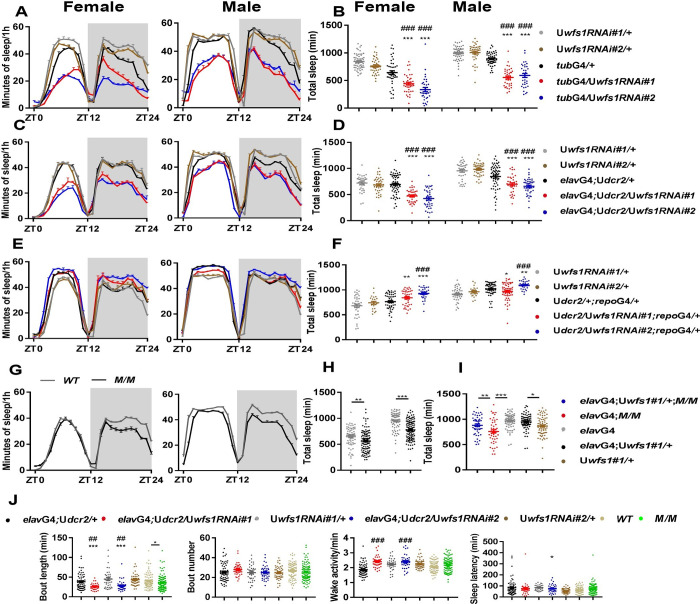
Fig 1. Wfs1 deficiency leads to reduced sleep and dampened locomotor rhythm.
The sleep of female and male flies are monitored under 12 h light: 12 h dark (LD) condition. (A, C, E and G) Sleep profile of wfs1 RNAi, mutant and control flies. Gray shade indicates the dark period. (B, D, F and H) Daily sleep duration of wfs1 RNAi, mutant and control flies. (I) Daily sleep duration of wfs1 mutant, pan-neuronal rescue and control flies. (J) Sleep bout length, bout number, wake activity and sleep latency of wfs1 RNAi, mutant and control flies. For comparison between RNAi or over-expression flies vs. UAS/GAL4 controls, one-way ANOVA was used: compared to GAL4 control, ##P < 0.01, ###P < 0.001; compared to UAS control, *P < 0.05, **P < 0.01, ***P < 0.001. For comparison between mutant vs. control, Mann-Whitney test or Student’s t-test was used: *P < 0.05, **P < 0.01, ***P < 0.001. For comparison between rescue vs. control, one-way ANOVA was used: **P < 0.01. n = 20–80. Error bars represent standard error of the mean (SEM). G4, GAL4; U, UAS; M, wfs1MI14041; ZT, Zeitgeber Time (ZT0 is the time of lights on).

