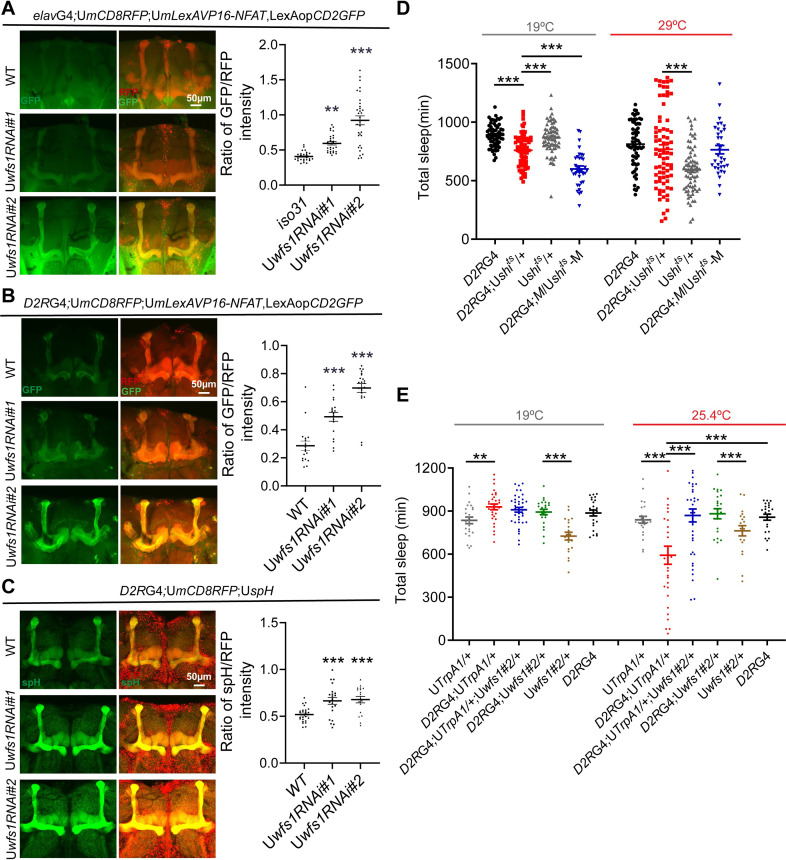
Fig 6. Wfs1 deficiency decreases sleep by altering the activity of Dop2R neurons.
(A) Left panel: representative images of adult fly brain with pan-neuronal expression of CaLexA and mCD8RFP. Right panel: quantification of GFP/RFP signal intensity in MB (two-way ANOVA, n = 28, 28, 32). (B) Left panel: representative images of adult fly brain expressing CaLexA and CD8RFP in Dop2R neurons. Right panel: quantification of GFP/RFP signal intensity in MB (two-way ANOVA, n = 18, 18, 22). (C) Left panel: representative images of adult fly brain with spH expression in Dop2R neurons. Right panel: quantification of spH/RFP signal intensity in MB (two-way ANOVA, n = 26, 22, 18). (D) Daily sleep duration of shits1-expressing wfs1 mutant flies and controls under permissive temperature (19°C) and restrictive temperature (29°C). n = 34–75. (E) Daily sleep duration of flies over-expressing wfs1 and TrpA1, as well as controls under baseline temperature (19°C) and activation temperature (25.4°C). n = 20–39. One-way ANOVA: *P < 0.05, **P < 0.01, ***P < 0.001. Error bars represent SEM. The scale bar represents 50 μm unless indicated otherwise. G4, GAL4; U, UAS; D2RG4, Dop2RGAL4.

