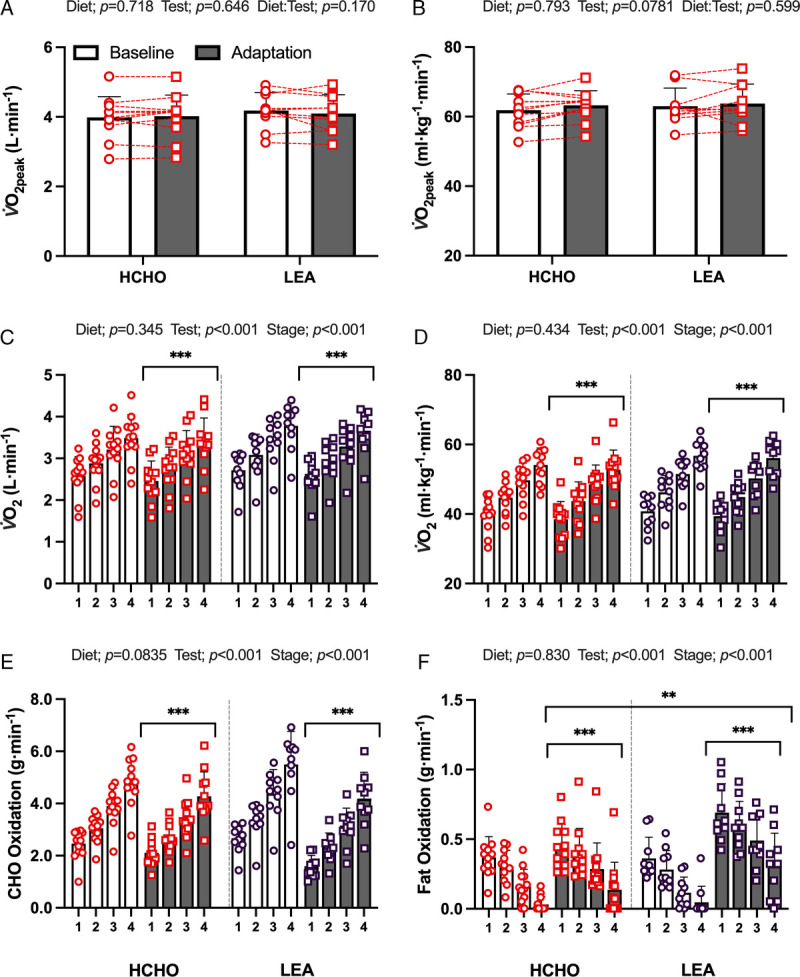
FIGURE 4.

Mean data and individual responses for absolute (A) and relative (B) V̇O2peak obtained during the incremental max test performed before baseline phase or after adaptation to an HCHO (n = 12) or an LEA (n = 10) diet in highly trained race walkers. Absolute (C) and relative (D) oxygen uptake and calculated substrate oxidation rates (E, CHO; F, fat) during the four-stage economy test. Data are presented as mean ± SD. Significant differences: **P < 0.01; ***P < 0.001.
