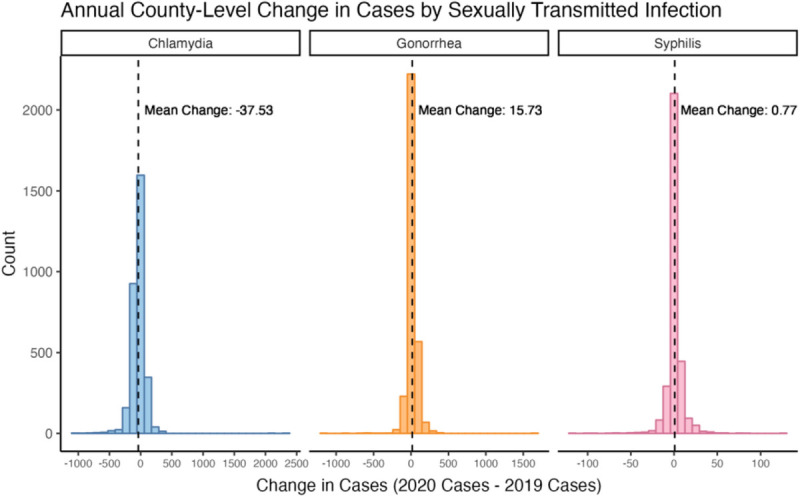
Figure 2.

Distribution of the change in chlamydia, gonorrhea, and syphilis cases across US counties. Note that each STI has its own x axis, but the y axis is shared. All changes are expressed as 2020 cases minus 2019 cases. Chlamydia cases decreased by an average of 37.5 cases (SD, 124), gonorrhea increased by an average of 15.7 cases (SD, 74.9), and syphilis increased by an average of 0.77 cases (SD, 9.74).
