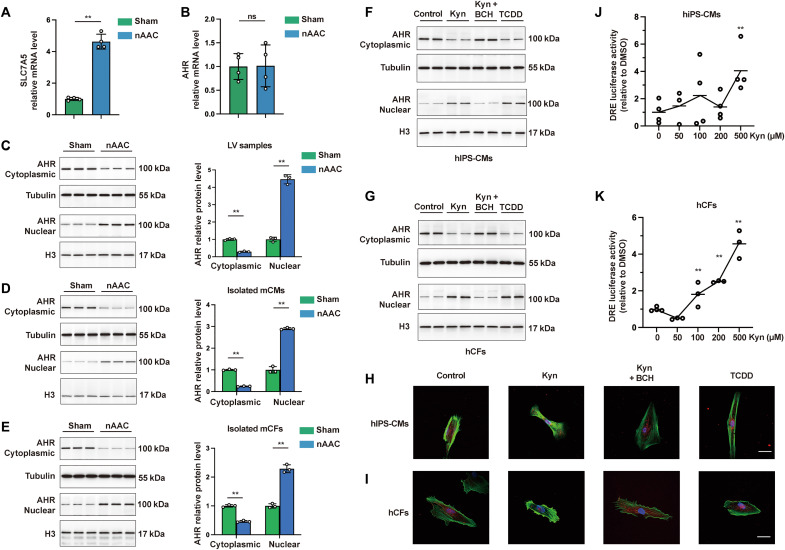
Fig. 2. Excessive plasma Kyn activates AHR in CMs and CFs in poLV.
(A) Quantitative polymerase chain reaction (qPCR) quantification of the Kyn transporter SLC7A5 between sham and nAAC LV samples. n = 4 per group. (B) mRNA level of AHR between sham and nAAC LV samples. n = 4 per group. (C to E) Western blotting (left) and quantification (right) of AHR protein in the cytoplasm and nucleus of LV samples (C), isolated mCMs (D), and isolated mice mCFs (E) from sham and nAAC mice. n = 3 per group. Each lane represented one animal. (F and G) Representative Western blotting of AHR in the cytoplasm and nucleus of hIPS-CMs (F) and hCFs (G), after 48 hours of treatment with 500 μM Kyn, 500 μM Kyn and 500 μM Kyn transporter inhibitor BCH, 500 μM AHR activator TCDD as positive control, or the same amount of dimethyl sulfoxide (DMSO) as negative control. Each lane represented individual experiment. (H and I) Representative immunofluorescence staining of AHR (red) in hIPS-CMs (H) and hCFs (I) treated by indicated compounds for 48 hours, with phalloidin staining (green) the F-actin in cytoplasm and 4′,6-diamidino-2-phenylindole (DAPI; blue) staining the nucleus. Scale bars, 25 μm. (J and K) DRE luciferase activity in hIPS-CMs (J) and hCF (K) treated with different dose of Kyn after 24 hours, each comparing to the baseline. n = 3 to 4 per group. Representative images from individual experiment in vitro [(F) to (I); n = 3 in each group]. Unpaired t test was used in (A) to (E). One-way analysis of variance (ANOVA) followed by the Bonferroni post hoc analysis was used in (J) and (K). ns, not significant; **P < 0.01.

