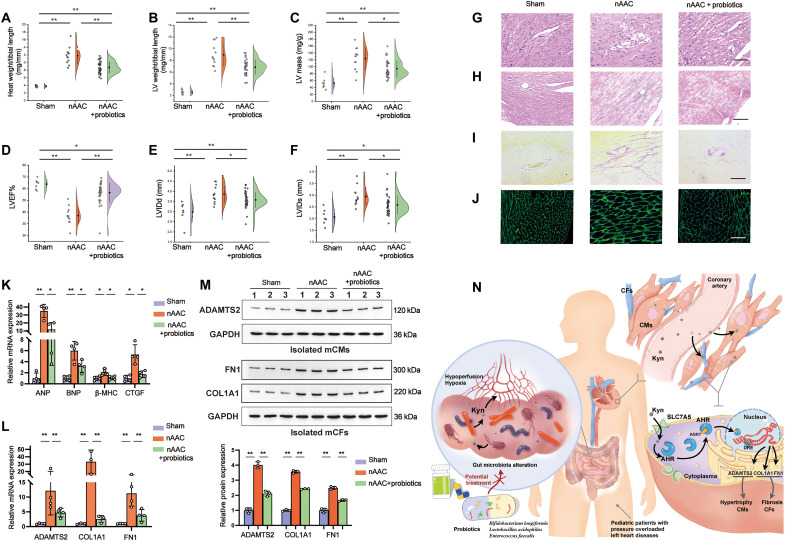
Fig. 7. Evaluation of the protective effect of probiotics on poLV remodeling.
(A and B) Gross evaluation of heart weight/tibial length (A) and LV weight/tibial length (B) in 4-week-old sham mice (n = 5), nAAC mice (n = 10), and nAAC mice supplied with probiotics (n = 34). (C to F) Echocardiography of the cardiac function and structural changes in 4-week-old mice of each group (n = 5, 10, and 34 as above), including estimated LV mass (C), LVEF% (D), LVIDd (E), and LVIDs (F). (G) Representative H&E staining of LV samples in corresponding groups, indicating the degree of myocardial hypertrophy. (H and I) Representative Masson staining (H) and Sirius Red staining (I) of LV samples in three groups, showing the degree of fibrosis. (J) Representative WGA fluorescence indicating CM surface areas. Scale bars, 50 μm. (K) qPCR analysis of the relative mRNA expression of cardiac function indicators (ANP and BNP), hypertrophy marker (b-MHC), and fibrosis marker (CTGF) of LV tissues in three groups. n = 4 per group. (L and M) qPCR [(L), n = 4], representative Western blotting and quantification [(M), n = 3] of ADAMTS2 in isolated CMs from the LV tissues of indicated mice, and FN1 and COL1A1 in isolated CFs from the LV tissues of three groups. (N) Graphic illustration of the main findings in this study. Kruskal-Wallis test and post hoc Dunn test were used in (A) to (F), (K), and (L). One-way ANOVA followed by the Bonferroni post hoc analysis were used in (M). *P < 0.05 and **P < 0.01. Each point represents the mean of an individual animal.

