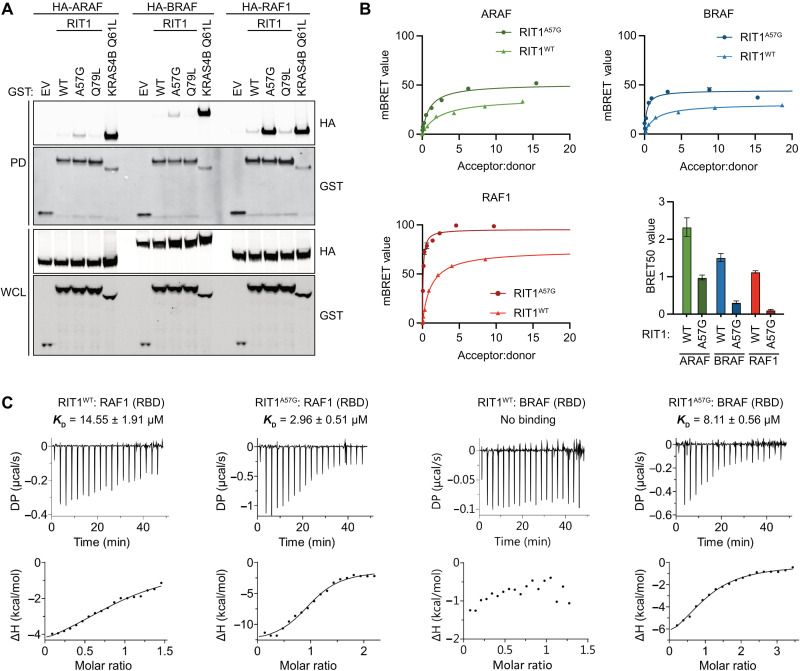
Fig. 3. RIT1 exhibits preferential binding to RAF1.
(A) Immunoblot analysis of indicated proteins precipitated by GST pull-down assay from HEK293T cell lysates expressing indicated constructs. DNA amounts for WT and mutant RIT1 were adjusted to normalize for protein expression. EV, empty vector; WCL, whole-cell lysate; PD, pulldown. (B) BRET curves show the relative binding affinities of mVenus-RIT1 (acceptor) and RAF-nanoLuc (donor) proteins. Representative BRET curves from three independent experiments are shown. The histogram demonstrates the mean BRET50 values ± SD of three independent experiments. (C) ITC measurements of recombinant RIT1:RAF(RBD) binding affinities. KD values represent an average of three independent experiments (n = 3).

