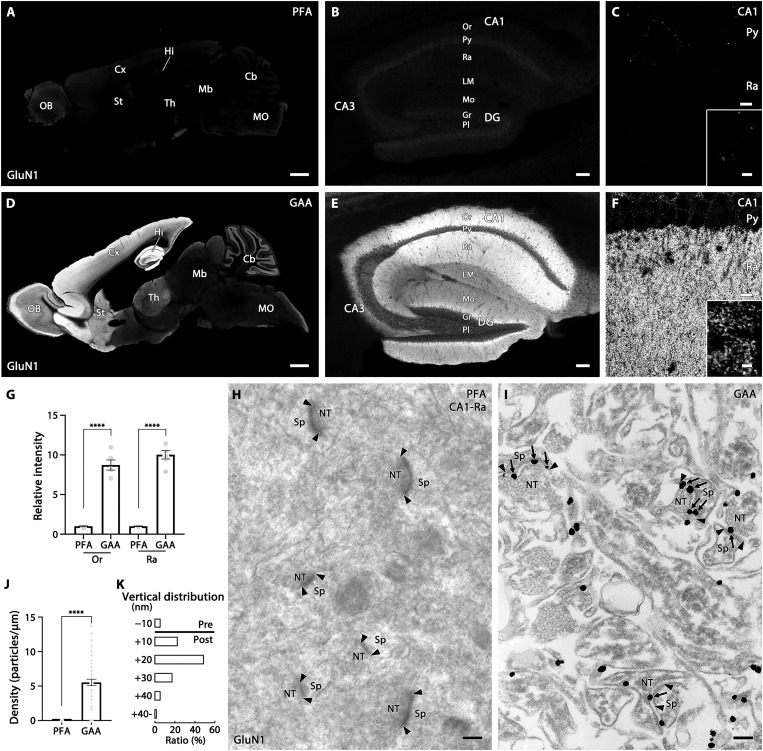
Fig. 3. Improved immunostaining for NMDAR GluN1 by GAA fixation of mouse brains.
(A to F) Immunofluorescence in PFA- (A to C) or GAA-fixed (D to F) brain (A and D), hippocampus (B and E), and CA1 region (C and F). (G) Histogram showing the mean relative intensity in GAA-fixed sections normalized to PFA-fixed sections in the CA1 stratum oriens (Or) and radiatum (Ra). Data were calculated from three images per mouse (n = 2 mice). (H and I) Pre-embedding silver-enhanced immunogold labeling in the CA1 stratum radiatum in PFA- (H) or GAA-fixed (I) hippocampus. Arrows and arrowheads indicate immunogold labeling and the edge of the postsynaptic density, respectively. (J) Histogram showing the mean labeling density of immunogold particles for GluN1 per 1 μm of the postsynaptic membrane at axo-spinous synapses in PFA- (n = 66 synapses from two mice) or GAA-fixed (n = 62 synapses from two mice) CA1 stratum radiatum. (K) The vertical distribution of the center of immunoparticles (n = 58 particles from two mice) at axo-spinous synapses of GAA-fixed CA1 stratum radiatum. In the ordinate, − and + represent the presynaptic and postsynaptic side, respectively, from the midline of the synaptic cleft. The distribution of immunogold particles for GluN1 peaks in a +10- to +20-nm postsynaptic bin, with a mean distance of +14.7 ± 1.2 nm. For detailed statistics, see Table S2 and S3. CA1–3, CA1–3 regions of Ammon’s horn; Cb, cerebellum; Cx, cortex; DG, dentate gyrus; Gr, granule cell layer; Hi, hippocampus; LM, stratum lacunosum-moleculare; Mb, midbrain; MO, medulla oblongata; Mo, molecular layer; NT, nerve terminal; OB, olfactory bulb; Or, stratum oriens; Pl, polymorphic cell layer; Py, pyramidal cell layer; Ra, stratum radiatum; Sp, spine; St, striatum; Th, thalamus. Scale bars, 1 mm (A and D); 100 μm (B and E); 10 μm (C and F) (inset, 2 μm); 200 nm (H and I).

