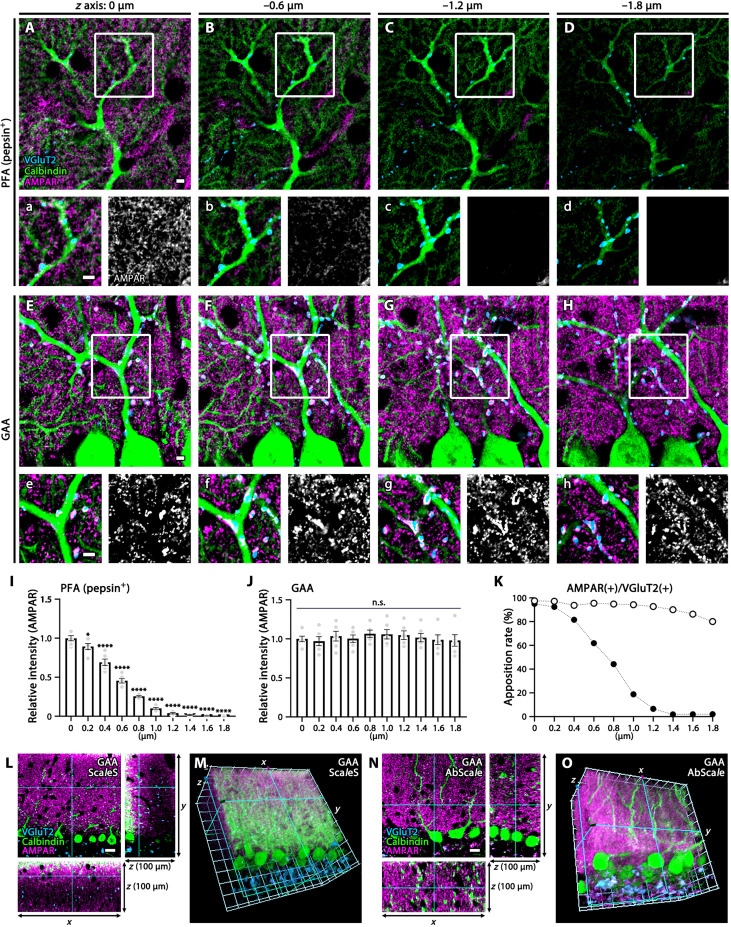
Fig. 4. Deep z-axis imaging of AMPAR by GAA fixation in the mouse cerebellar cortex.
(A to H and L to O) Immunofluorescence for AMPAR (magenta), VGluT2 (blue), and calbindin (green) in PFA- (A to D) or GAA-fixed (E to H and L to O) cerebellar sections. PFA-fixed sections were subjected to pepsin digestion before immunostaining (A to D). Consecutive images along the z axis [0.2-μm steps, (A) to (H); 1-μm steps, (L) to (O)] were captured. Boxed regions in (A) to (H) are enlarged in (a) to (h), and AMPAR signals are separately shown in white. See also fig. S6 for faint surface signals of glial AMPAR in pepsin-undigested PFA-fixed sections and fig. S7 (D to F) for deeper imaging of synaptic AMPAR from the surface (0 μm) to −50 μm deep in GAA-fixed 100-μm-thick sections. (I and J) Histograms showing the mean relative intensity of AMPAR along the z axis (0 to −1.8-μm depth) in PFA- (I) or GAA-fixed (J) sections. The mean relative intensity at the surface is defined as 1.0, and statistically significant decreases at deeper regions are shown by *P < 0.05 and ****P < 0.0001. Data were calculated from three images per mouse (n = 2 mice). (K) Histogram showing the apposition rate of VGluT2(+) presynaptic and AMPAR(+) postsynaptic puncta at 0 to −1.8 μm deep. The xy, xz, and yz planes of images (L and N) and 3D-recontructed images (M and O) of GAA-fixed 100-μm-thick cerebellar sections, to which the tissue clearing method of ScaleS was applied after immunoreaction (L and M) or the tissue clearing method of AbScale was applied during immunoreaction (N and O). For detailed statistics, see Table S2 and S3. Scale bars, 20 μm (L and N); 10 μm (A to H).

