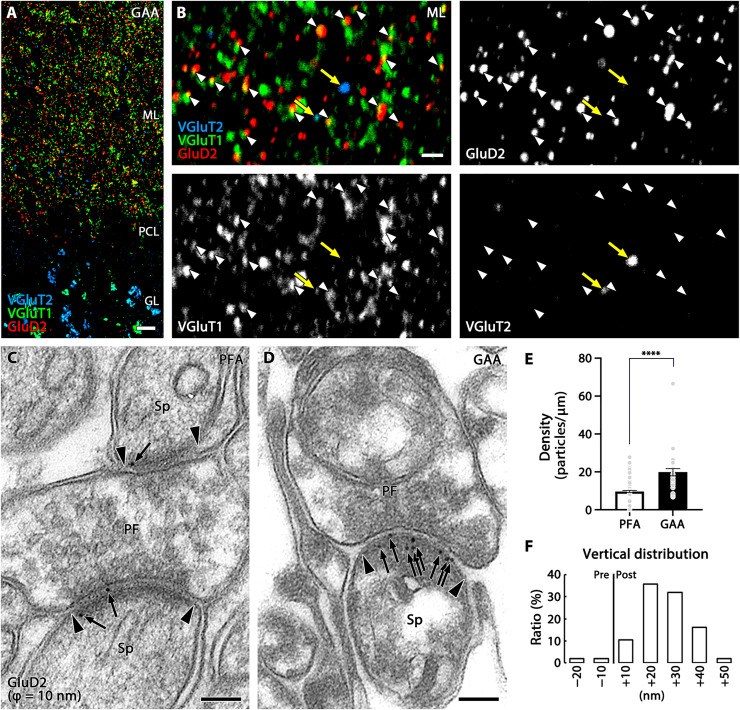
Fig. 5. Signal intensification in postembedding immunofluorescence and immunogold labeling of GluD2 in GAA-fixed mouse cerebellum.
(A and B) Triple immunofluorescence for GluD2 (red), VGluT1 (green), and VGluT2 (blue) in ultrathin Lowicryl sections of GAA-fixed cerebellar cortex. Improved spatial resolution and signal intensity allow apposition of GluD2 clusters to VGluT1(+) parallel fiber terminals (white arrowheads), but not to VGluT2(+) climbing fiber terminals (yellow arrows), to be clearly demonstrated. (C and D) Post-embedding immunogold electron microscopy for GluD2 (ϕ = 10 nm) in PFA- (C) or GAA-fixed (D) ultrathin Lowicryl sections. Arrows and arrowheads indicate immunogold labeling and the edge of the postsynaptic density, respectively. (E) Histogram showing the mean density of immunogold particles for GluD2 per 1 μm of the postsynaptic membrane obtained from n = 159 synapses from two mice (PFA) and 32 synapses from two mice (GAA). (F) Histogram showing the vertical distribution of GluD2 immunogold at parallel fiber-Purkinje cell synapses in GAA-fixed ultrathin Lowicryl sections. See legend for Fig. 3K for measurement method. The distribution of immunogold particles (n = 106 particles from two mice) peaked in a +10- to +20-nm postsynaptic bin, with a mean distance of +19.54 ± 1.09 nm from the midline of the synaptic cleft. For detailed statistics, see Table S2 and S3. PF, parallel fiber terminal; Sp, dendritic spine. For other abbreviations, see Fig. 1. Scale bars, 10 μm (A); 2 μm (B); 100 nm (C and D).

