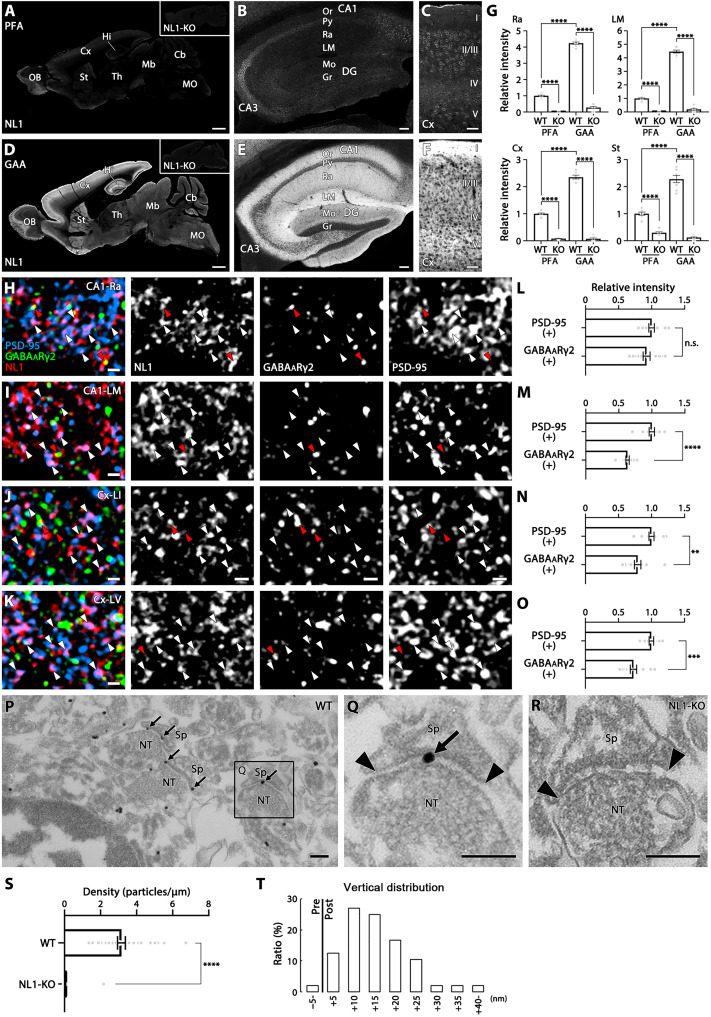
Fig. 6. Visualization of specific immunosignals for synaptic adhesion molecule NL1 in GAA-fixed mouse brains.
(A to F) Immunofluorescence for NL1 in PFA- (A to C) or GAA-fixed (D to F) brain (A and D), hippocampus (B and E), and cortex (C and F). (G) Histograms showing that the mean relative intensity is significantly increased in GAA-fixed CA1 stratum radiatum, CA1 stratum lacunosum-moleculare, cortex, and striatum than in PFA-fixed ones. The intensity of PFA-fixed wild-type mice is defined as 1.0. Data were measured from five images per mouse (n = 2 mice). (H to K) Triple immunofluorescence for NL1 (red), PSD-95 (blue), and GABAARγ2 (green) in the stratum radiatum (H) and stratum lacunosum-moleculare (I) of the hippocampal CA1, and in layers 1 (J) and 5 (K) of the somatosensory cortex. White and red arrowheads indicate NL1 clusters that are apposed to PSD-95- or GABAARγ2-positive clusters, respectively. (L to O) Histograms showing that the mean relative intensity of NL1 clusters apposing to PSD-95(+) clusters or GABAARγ2(+) clusters in the CA1 stratum radiatum (L, PSD-95 clusters, n = 1567; GABAARγ2 clusters, n = 1049, from two mice), CA1 lacunosum-moleculare (M, 1801, 1436, from two mice), and in layer 1 (N, 1346, 1186 from, two mice) and layer 5 (O, 1393, 741, from two mice) of the somatosensory cortex. The intensity of NL1 clusters apposing to PSD-95 clusters is defined as 1.0. n.s., not significant. (P to R) Pre-embedding silver-enhanced immunogold labeling in the CA1 stratum radiatum in GAA-fixed wild-type (P and Q) or NL1-knockout (R) mice. Arrows and arrowheads indicate immunogold labeling and the edge of the postsynaptic density, respectively. (S) Histogram showing the mean labeling density of immunogold particles for NL1 per 1 μm of the postsynaptic membrane at axo-spinous synapses of GAA-fixed CA1 stratum radiatum in wild-type (n = 37 synapses from two mice) or NL1-knockout (n = 69 synapses from two mice) mice. (T) The vertical distribution of the center of immunoparticles (n = 48 particles from two mice) at axo-spinous synapses of GAA-fixed CA1 stratum radiatum. See legend for Fig. 3K for measurement method. For detailed statistics, see Table S2 and S3. For abbreviations, see Fig. 3. Scale bars, 1 mm (A and D); 100 μm (B and E); 50 μm (C and F); 1 μm (H to K); 200 nm (P to R).

