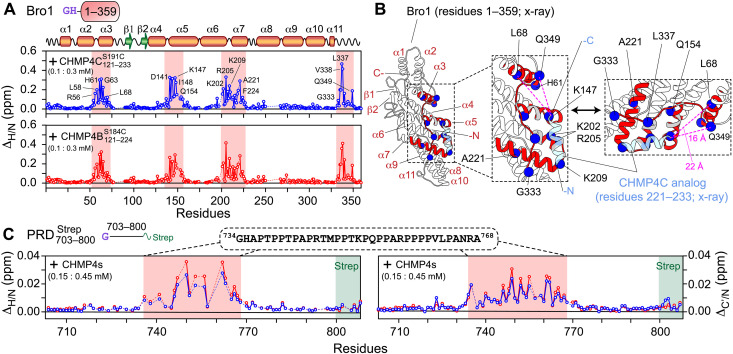
Fig. 4. NMR analysis of ALIX-CHMP4 interactions.
(A) 1HN/15N chemical shift perturbation profiles of 100 μM 15N/2H-labeled Bro1 on addition of 300 μM unlabeled CHMP4 constructs; (top, blue) and (bottom, red). Secondary structure elements and the scheme of Bro1 construct (fig. S6) used in these experiments are indicated above the panel. Red rectangles indicate regions that exhibit large chemical shift perturbations; a few of the affected residues are labeled. Dashed lines indicate proline residues or residues that could not be assigned unambiguously. (B) Ribbon diagram of the x-ray structure of the complex between Bro1 (white ribbons) and CHMP4C peptide analog (light blue ribbons) (10). Bro1 motifs that undergo large chemical shift changes in the presence of (A, top) are marked in red ribbons. A few affected residues are depicted by blue spheres. Gray ribbons indicate residues around the interaction site that could not be assigned unambiguously. Dashed magenta lines mark the distances between two representative Bro1 residues (L68 and Q349) and the C terminus of the CHMP4C peptide analog. (C) 1HN/15N and 13C′/15N chemical shift perturbation profiles of 150 μM 15N/13C-labeled in the presence of 450 μM unlabeled CHMP4 constructs [same color scheme as (A)]. The scheme of (fig. S6) and the primary sequence of the affected region (residues 734 to 768) marked by semitransparent red rectangles are shown above the graphs. The position of the C-terminal strep tag (residues 801 to 808) is denoted by semitransparent green rectangles. All NMR experiments were performed at 30°C in 20 mM sodium phosphate (pH 6.5), 1 mM TCEP, and 2 mM EDTA at a spectrometer 1H frequency of 800 MHz.

