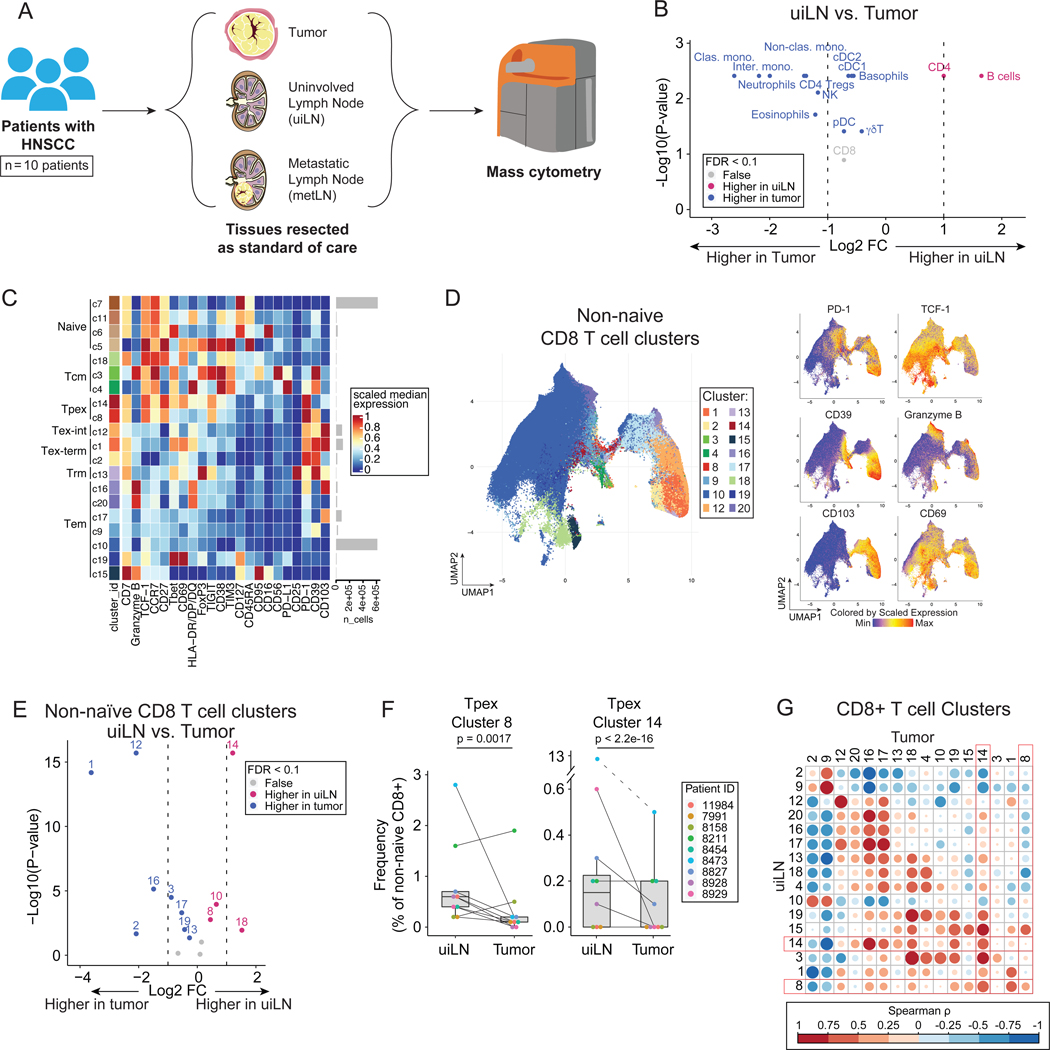
Figure 1: Tpex cells are increased in uninvolved lymph nodes of HNSCC patients.
A) Overview of cohort. Paired tumor and lymph node samples (uninvolved; uiLN and/or metastatic; metLN) were obtained from patients with HNSCC (n = 10). Samples were analyzed by mass cytometry. B) Paired differential abundance (DA) of main immune cell populations between uiLN and tumor (n = 9; paired Wilcoxon Rank Sum Test). The log2 fold changes are plotted against the negative log10 (nominal p-values). Colors indicate if cell populations are significantly more abundant in uiLN (purple), tumor (blue), or not differentially abundant (False, grey) after Benjamini-Hochberg correction, FDR < 0.1. C) Heatmap of markers used for CD8+ T cell clustering. Scaled median expression per marker is shown for cluster annotation. D) UMAP of non-naïve CD8+ T cell clusters and expression for a subset of markers. E) Paired differential abundance analysis of non-naïve CD8+ T cell subsets between uiLN and tumor (n = 9; generalized linear mixed models). See color scheme for Figure 1B. F) Cluster 8 and 14 abundances (as percentage of non-naïve CD8+ T cells) in paired samples from uiLN and tumor. P-values obtained by generalized linear mixed models. G) Spearman correlation between clusters in uiLN and clusters in tumors. Tpex clusters are highlighted in red boxes. See also Figure S1.

