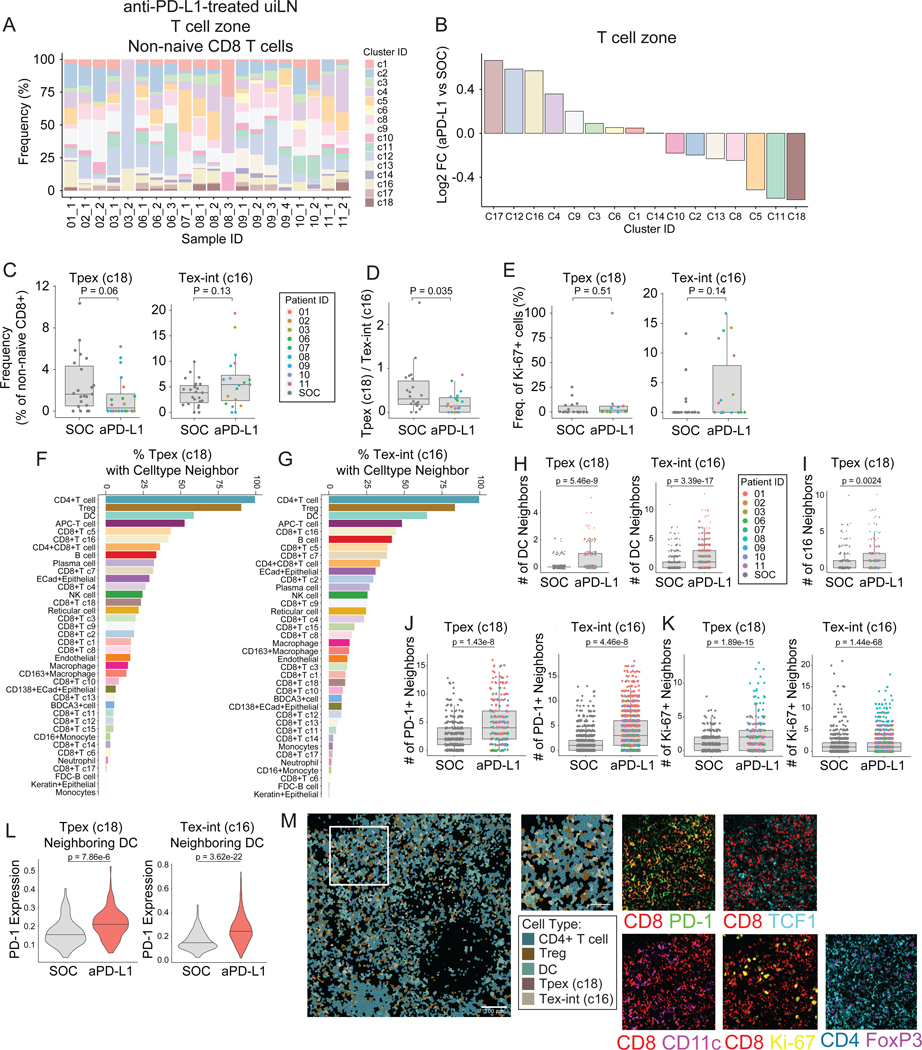
Figure 4: anti-PD-L1 ICB impacts Tpex and Tex-int in uiLN.
A) Relative abundance of non-naïve CD8+ T cell clusters in uiLN (T cell zone, n = 20) from anti-PD-L1 treated patients (n = 9). Sample ID represents patient ID followed by LN number. B) Non-naïve CD8+ T cell cluster ratios represented as log2 fold changes between uiLN (T cell zone, n = 20) from anti-PD-L1 treated patients and uiLN (T cell zone, n = 22) from SOC treated patients. C) Cluster 18 and 16 abundances (as percentage of non-naïve CD8+ T cells) in the T cell zone of uiLN from SOC and anti-PD-L1 treated patients. D) Cluster 18/cluster 16 ratio in uiLN (T cell zone) from SOC and anti-PD-L1 treated patients. E) Percentage of cluster 18 and 16 proliferating cells in uiLN (T cell zone) from SOC and anti-PD-L1 treated patients. F-G) Percentage of (F) cluster 18 and (G) cluster 16 cells with a specific cell type as its neighbor in uiLN (T cell zone) from anti-PD-L1 treated patients. H) Number of DC neighbors for cluster 18 and cluster 16 cells in uiLN (T cell zone) from SOC and anti-PD-L1 treated patients. I) Number of cluster 16 neighbors for cluster 18 cells in uiLN (T cell zone) from SOC and anti-PD-L1 treated patients. J-K) Number of (J) PD-1 positive and (K) Ki-67+ neighbors for cluster 18 and cluster 16 cells in uiLN (T cell zone) from SOC and anti-PD-L1 treated patients. L) Expression of PD-1 on cluster 18 and cluster 16 cells with a DC neighbor in uiLN (T cell zone) from SOC and anti-PD-L1 treated patients. M) Representative image of an uiLN from an anti-PD-L1 treated patient (patient 01) showing the spatial localization of CD4 T cells, Tregs, DCs, Tpex (cluster 18), and Tex-int (cluster 16). Cell identity overlaid onto the segmentation mask. Highlighted region is colored by the expression of CD8+ (red), PD-1 (green), TCF-1 (cyan), CD11c (purple), Ki-67 (yellow), CD4 (cyan), and FoxP3 (purple). C-E and H-L) P-values obtained by Wilcoxon Rank Sum Test. See also Figure S4.

