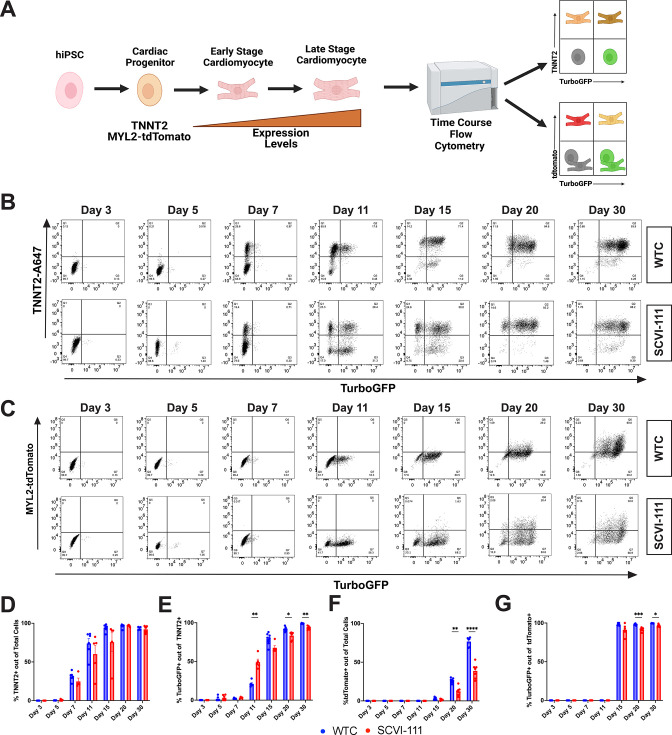
Figure 2. T-box transcription factor (TBX5)-lineage tracing reveals a predominance of lineage positive cardiomyocytes through the course of human-induced pluripotent stem cell (hiPSC) cardiac differentiation.
(A) Schematic of analysis approach of reporter system expression through the course of cardiac differentiation. (B) Representative flow cytometry plots for the expression of TurboGFP and cardiac troponin T staining between day 3–30 of differentiation for WTC and SCVI-111 reporter lines. Gating set based on day 3 of differentiation. (C) Representative flow cytometry for the expression MYL2-tdTomato and TurboGFP between day 3 and30. Gating set based on day 3 of differentiation. (D) Quantification of percentage cardiac troponin T (TNNT2) expressing cells across all cells sampled. (E) Quantification of the percentage of TurboGFP-positive cells out of cardiac troponin-positive cardiomyocytes. (F) Quantification of tdTomato expressing cells across total cells sampled. Quantification of TurboGFP-positive cells out of MYL2-Tdtomato cardiomyocytes. N=4-8 independent biological replicates were collected per sample. Statistical significance determined by two-way ANOVA with first independent variable analyzed being time and the second variable being cell line. *p <0.05, **p<0.01, ***p<0.001, ****p<0.0001. Error bars represent standard error of the mean (SEM).


