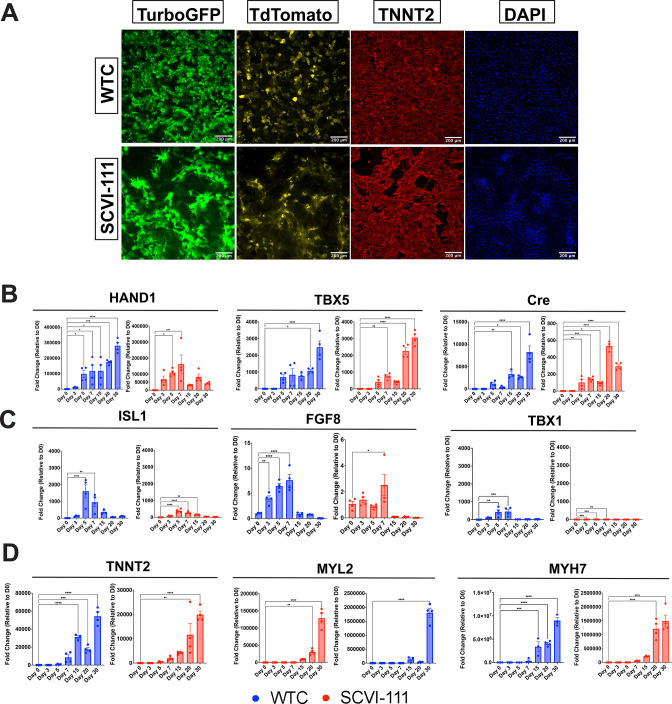
Figure 3. Immunofluorescence imaging of day 30 reporter cardiomyocytes and RT-qPCR profiling of first heart field (FHF) and second heart field (SHF) markers across differentiation.
(A) Immunofluorescence images of TurboGFP, TdTomato, and TNNT2 expression at day 30 of cardiac differentiation for WTC and SCVI-111 reporter lines. (B) RT-qPCR profiling of FHF markers HAND1 and TBX5 along with Cre Recombinase between day 0 and 30 of differentiation. (C) RT-qPCR profiling of pan-cardiac progenitor marker ISL1, and SHF markers TBX1 and FGF8 between day 030 of differentiation. (D) RT-qPCR profiling of pan-cardiomyocyte marker TNNT2. (E) RT-qPCR profiling of ventricular marker myosin light chain-2 (MYL2). N=3–4 biological replicates per timepoint. Significance determined by one-way ANOVA with Dunnet’s multiple comparisons correction. *p<0.05, **p<0.01, ***p<0.001, ****p<0.0001. Error bars represent standard error of the mean (SEM).

