. 2023 Jun 7;12:e80075. doi: 10.7554/eLife.80075

Figure 4. single-cell RNA sequencing (scRNA-seq) profiling and trajectory inference reveals emergence of myocardial and epicardial lineages during human-induced pluripotent stem cell (hiPSC) cardiac differentiation.

(A) Diagram of scRNA-seq multiplexing for profiling of 12 timepoints across two lines during hiPSC cardiac differentiation. (B) Left, UMAP plot with identification of 13 cell populations over the course of cardiac differentiation. Right-Top, Plot indicating labeling of cells captured from WTC and SCVI-111 line. Right-Bottom, Plot indicating timepoints of differentiation at which cells were captured for scRNA-seq. N=27,595 single cells. (C) Dotplot presenting the expression of top markers for major cell populations identified during hiPSC cardiac differentiation. (D) Subway map plot showing the projection of cells along cell lineages detected using STREAM analysis. (E) Stream plot indicating the relative cell type composition along each branch of differentiation identified by STREAM. (F) Graph indicating pseudotime values calculated by STREAM for ordering cells along a continuous developmental projection axis. (G) Feature plots for top gene markers identified during each major developmental phase of hiPSC cardiac differentiation.

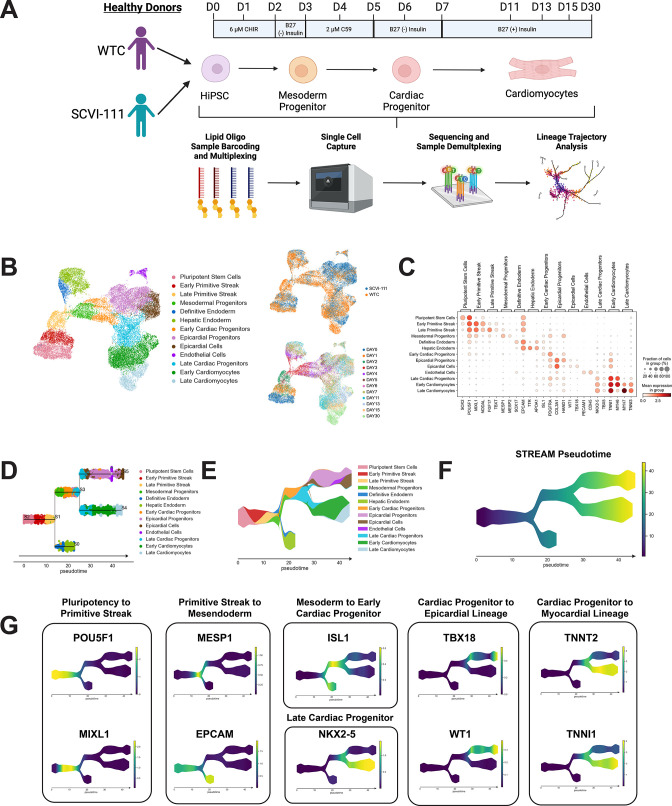
Figure 4—source data 1. GEO Accession Numbers for Datasets.
Figure 4—source data 2. Differentially Expressed Genes Identified For Annotated Cell Types.
elife-80075-fig4-data2.xlsx (543.6KB, xlsx)
Figure 4—source data 3. Genes Correlated with Differentiation Trajectories Identified During hiPSC Cardiac Differentiation.
elife-80075-fig4-data3.xlsx (156.8KB, xlsx)
Figure 4—source data 4. Description of scRNA-seq Run and hashtag oligo sequences used for sample multiplexing.

Figure 4.

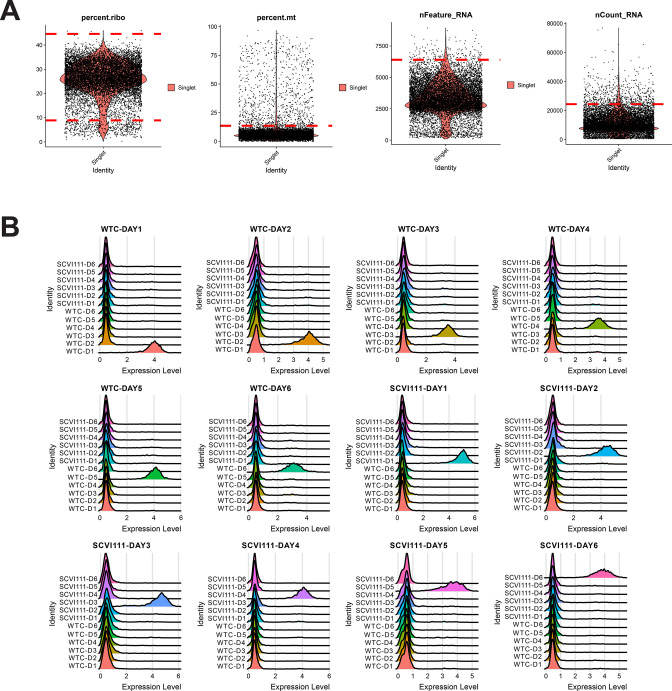
Figure 4—figure supplement 1. Quality control and hashtag oligo labeling of samples for scRNA-seq sample Galdos_Seq_Run1.

Figure 4—figure supplement 1.

(A) Cutoff values (dotted red lines) were calculated for quality control filtering of four metrics evaluated. (B) Ridge plots demonstrating highly specific labeling of chemically modified oligos for multiplexing of day 1–6 samples across two human-induced pluripotent stem cell (hiPSC) lines.
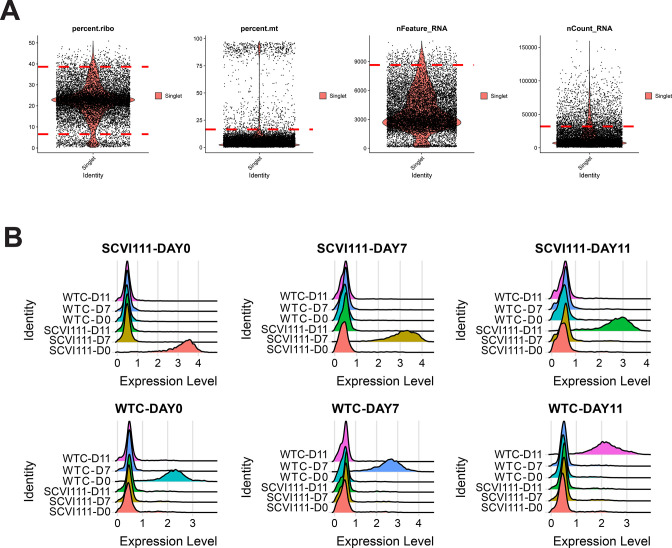
Figure 4—figure supplement 2. Quality control and hashtag oligo labeling of samples for scRNA-seq sample Galdos_Seq_Run2.

Figure 4—figure supplement 2.

(A) Cutoff values (dotted red lines) were calculated for quality control filtering of four metrics evaluated. (B) Ridge plots demonstrating highly specific labeling of chemically modified oligos for multiplexing of day 0, 7, and 11 samples across two human-induced pluripotent stem cell (hiPSC) lines.
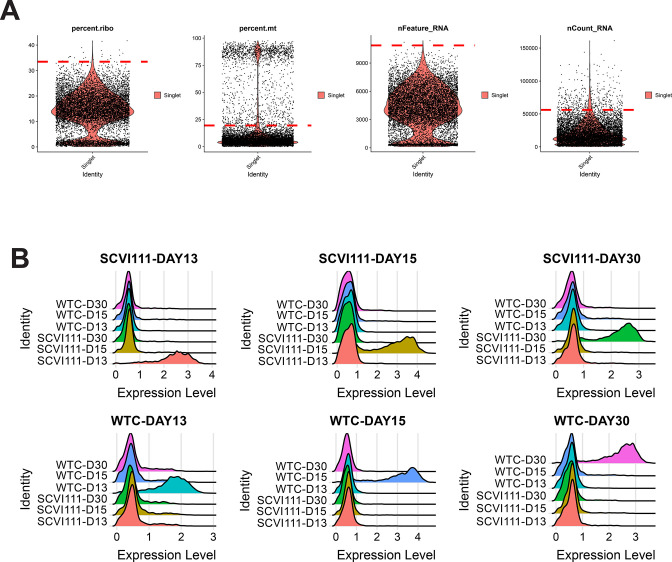
Figure 4—figure supplement 3. Quality control and hashtag oligo labeling of samples for scRNA-seq sample Galdos_Seq_Run3.

Figure 4—figure supplement 3.

(A) Cutoff values (dotted red lines) were calculated for quality control filtering of four metrics evaluated. (B) Ridge plots demonstrating highly specific labeling of chemically modified oligos for multiplexing of day 13, 15, and 30 samples across two human-induced pluripotent stem cell (hiPSC) lines.
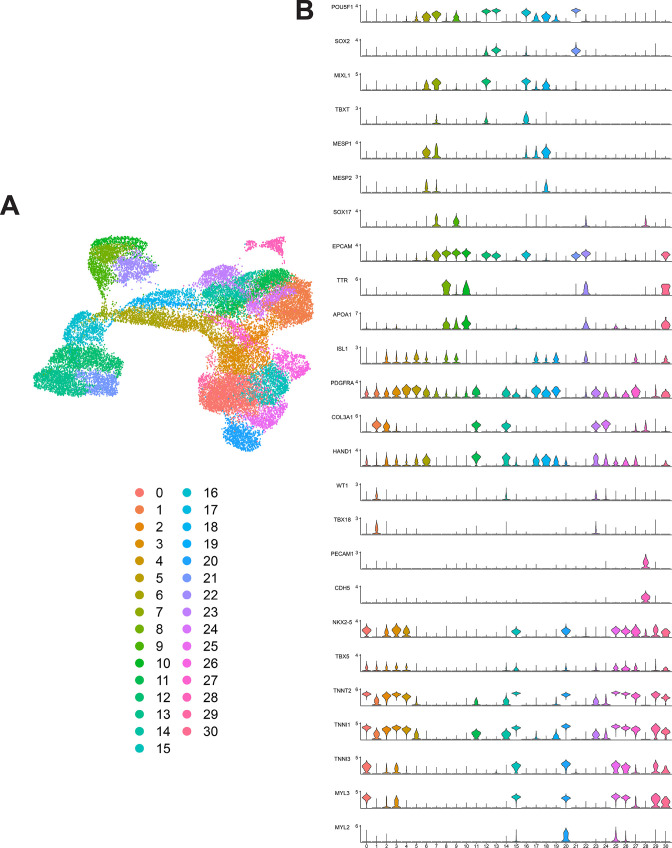
Figure 4—figure supplement 4. Unsupervised clustering and marker expression of combined human-induced pluripotent stem cell (hiPSC) single-cell RNA sequencing (scRNA-seq) data from WTC and SCVI-111 lines.

Figure 4—figure supplement 4.

(A) UMAP embedding for combined scRNA-seq data from WTC and SCVI-111 lines, along with unsupervised clustered identified. (B) Stacked violin plots for distinct cell markers enriched across all clusters identified.
Figure 4—figure supplement 5. Trajectory inference analysis of human-induced pluripotent stem cell (hiPSC) cardiac differentiation across WTC and SCVI-111 Lines.

Figure 4—figure supplement 5.

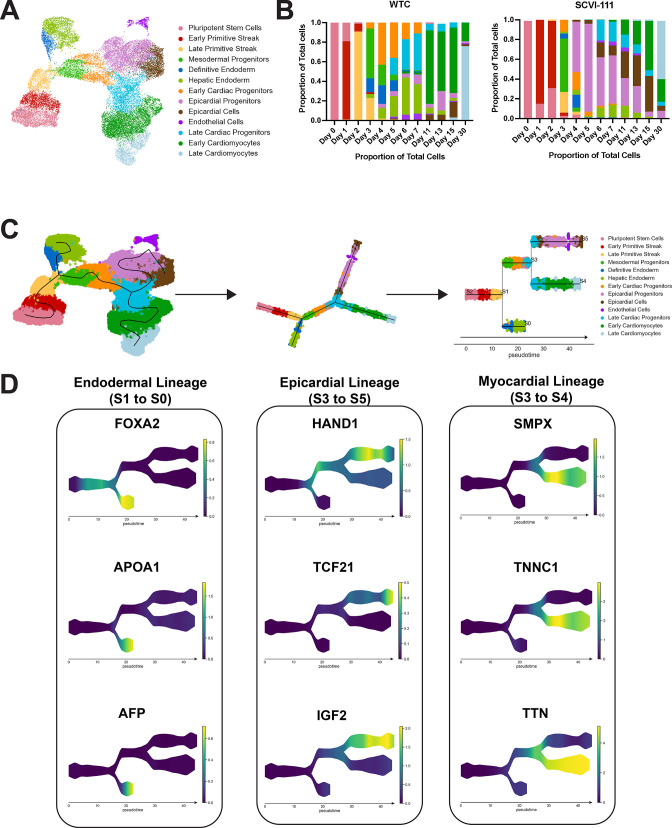
(A) UMAP embedding reproduced from Figure 4A demonstrates annotation of 12 distinct cell types. (B) Compositional analysis showing the proportion of each cell type identified across all timepoints for both WTC and SCVI-111 lines. (C) STREAM algorithm fitting of principal graphs and trajectory inference detection. Cells were ordered along principal graphs and calculated pseudotime values. (D) Expression of statistically significant gene markers along differentiation trajectories identified during hiPSC cardiac differentiation.
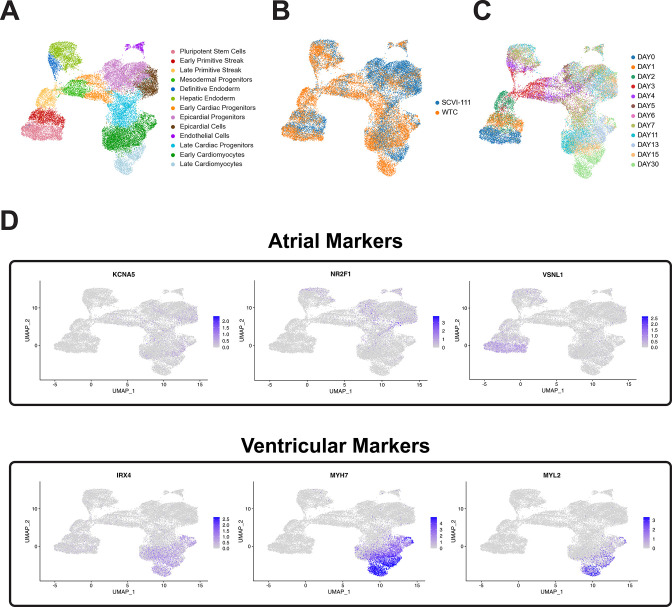
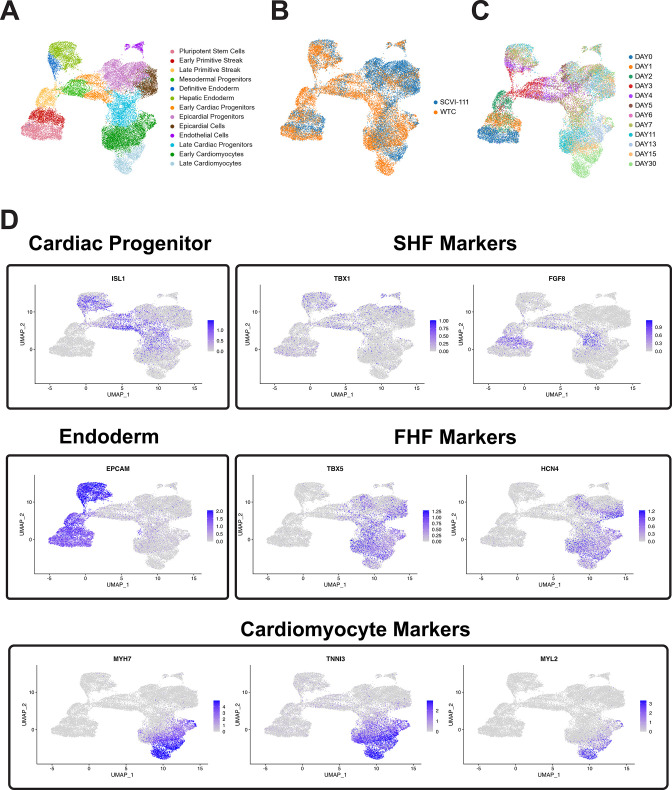
Figure 4—figure supplement 6. Feature plots of selected first heart field (FHF), second heart field (SHF), endoderm, and cardiomyocyte markers.

Figure 4—figure supplement 6.

(A) UMAP of human-induced pluripotent stem cell (hiPSC) cardiac differentiation showing cell type annotation, (B) cell line of origin, and (C) timepoint during differentiation. (D) Feature plots showing gene expression of selected genes in individual cells along the UMAP plot.
Figure 4—figure supplement 7. Comparison of expression of atrial and ventricular cardiomyocyte markers in human-induced pluripotent stem cell (hiPSC)-CM single-cell RNA sequencing (scRNA-seq) time course.

Figure 4—figure supplement 7.

(A) UMAP of hiPSC cardiac differentiation showing cell type annotation, (B) cell line of origin, and (C) timepoint during differentiation. (D) Feature plots showing gene expression of atrial markers (KCNA5, NR2F1, and VSNL1) and ventricular markers (IRX4, MYH7, and MYL2).