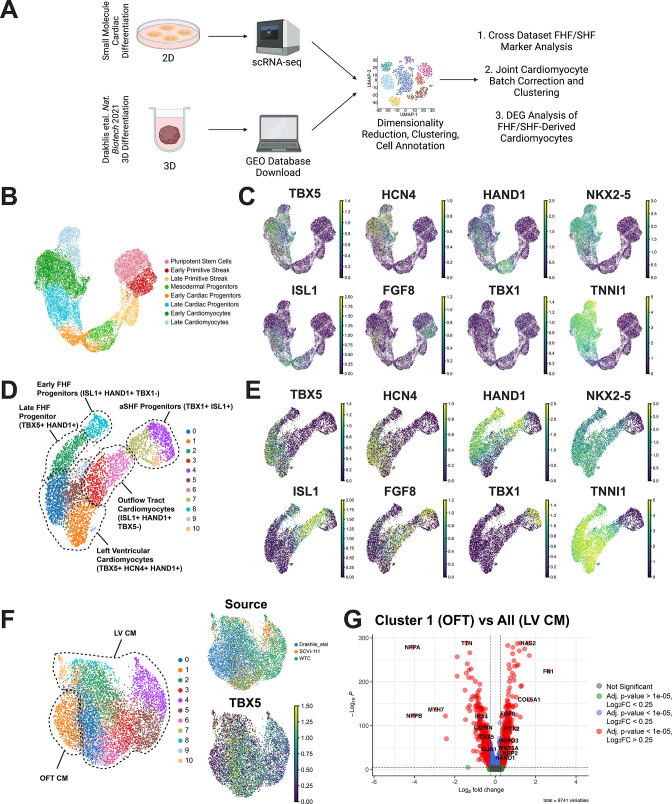
Figure 6. Comparison of 2D and 3D cardiac differentiation uncovers potential of organoid system for second heart field (SHF) generation.
(A) Schematic of comparison strategy of single-cell RNA sequencing (scRNA-seq) data from 2D human-induced pluripotent stem cell (hiPSC) cardiac differentiation generated using our 2D protocol and a previously published organoid protocol. (B) UMAP plot of the myocardial lineage identified during 2D hiPSC cardiac differentiation. (C) Feature plots of first heart field (FHF) (TBX5, HCN4, HAND1), pan-cardiac (ISL1, NKX2-5, TNNI1), and SHF (FGF8, TBX1) during 2D hiPSC differentiation. (D) UMAP plot of Drakhlis et al., cardiac lineage cells with annotation of unsupervised clusters. (E) Feature plots of FHF (TBX5, HCN4, HAND1), pan-cardiac (ISL1, NKX2-5, TNNI1), and SHF (FGF8, TBX1) during organoid differentiation. (F) Co-clustering of 2D and 3D cardiomyocytes with annotation of source dataset (right-top) and expression of T-box transcription factor (TBX5) (right-bottom). (G) Volcano plot for top differentially expressed genes between OFT identified cluster and the remainder of identified cardiomyocytes identified as left ventricular.

