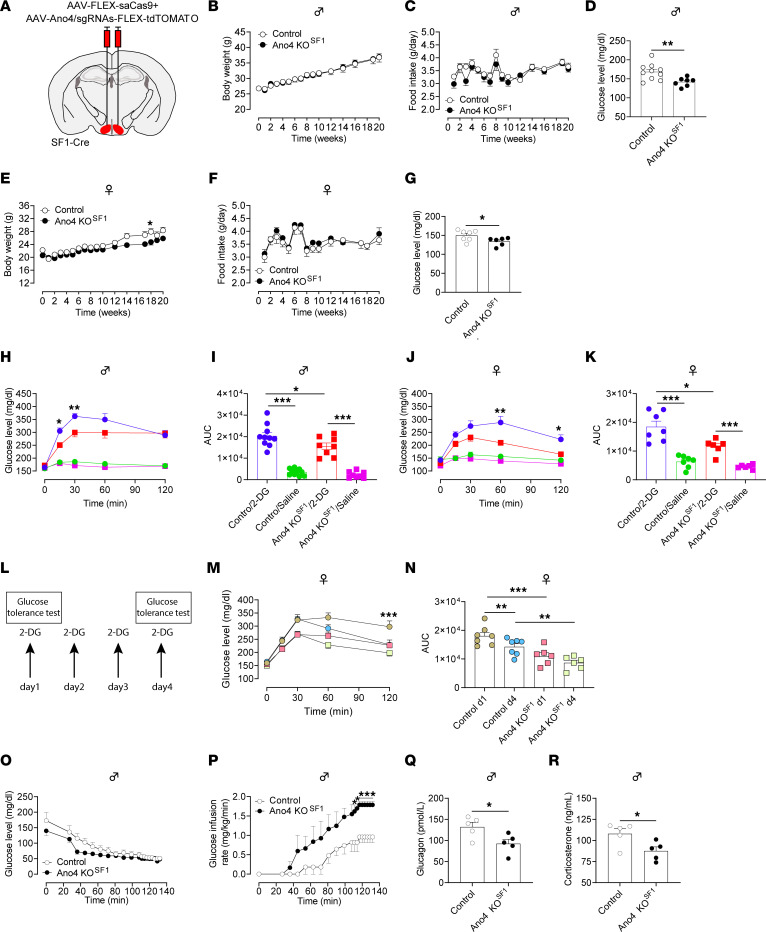
Figure 2. Knockout of Ano4 in VMHSF1 neurons induces hypoglycemia and blunts counterregulatory response.
(A) Schematic representation of CRISPR-mediated knockout of Ano4 in both sides of VMHSF1 neurons in SF1-Cre mice. (B–D) Body weight, food intake, and blood glucose in male mice (n = 10 for control, and n = 7 for Ano4 KOSF1). (E–G) Body weight, food intake, and blood glucose in female mice (n = 10 for control, and n = 7 for Ano4 KOSF1). (H–K) Blood glucose levels and respective AUC after treatment with 2-DG (300 mg/kg, i.p.) or saline (10 mL/kg, i.p.) in male mice (H and I, n = 10 for control, and n = 7 for Ano4 KOSF1) and female mice (J and K, n = 7 for control, and n = 6 for Ano4 KOSF1). (L–N) Response to repeated treatment with 2-DG (300 mg/kg, i.p.) with glucose measurement on day 1 and day 4 in female mice (n = 7 for Control, and n = 6 for Ano4 KOSF1). (O–R) Blood glucose levels (O) and glucose infusion rate (P) throughout the recording of hyperinsulinemic-hypoglycemic clamp in male mice (n = 5 for control and Ano4 KOSF1). Blood glucagon and corticosterone levels at the fixed hypoglycemic status (Q–R, n = 5 for control and Ano4 KOSF1). Data are expressed as mean ± SEM. Significant differences between control and Ano4 KOSF1 groups are shown as *P < 0.05, **P < 0.01, and ***P < 0.01 (2-tailed Student’s t test for D, G, Q and R; 2-way ANOVA followed by Bonferroni tests for E, H, J, M, and P; 1-way ANOVA with Bonferroni’s adjustment for multiple comparisons for I, K, and N.).

