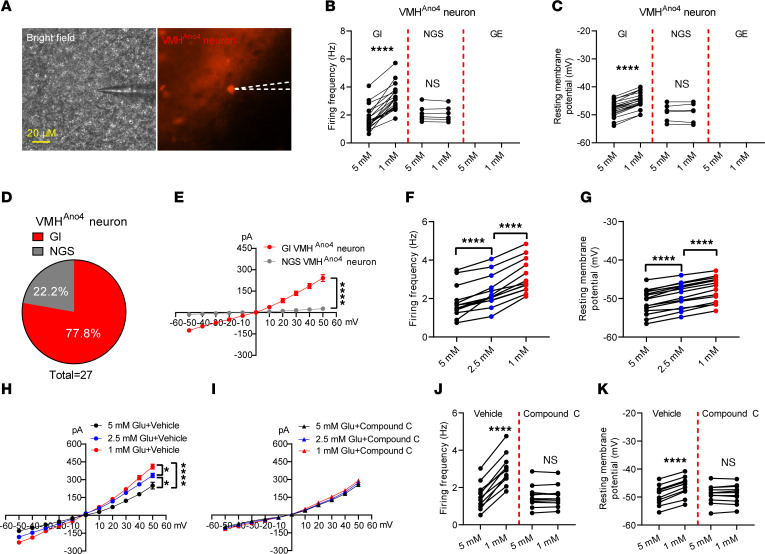
Figure 3. Electrical responses of VMHAno4 neurons to glucose fluctuation.
(A) Experimental illustration of a recorded VMHAno4 neuron. (B–D) Firing frequency, resting membrane potential, and percentages of GI and NGS neurons in VMHAno4 neurons under glucose exposure from 5 → 1 mM (n = 0 for GE, n = 21 for GI, and n = 6 for NGS). (E) Ano current was detected in GI VMHAno4 neurons and was minimal in NGS VMHAno4 neurons (n = 6 for GI and NGS). (F and G) Firing frequency and resting membrane potential of VMHAno4 neurons under glucose exposure from 5 mM → 2.5 mM → 1 mM (n = 13). (H) Ano current detected in VMHAno4 neurons under different glucose fluctuations from 5 mM → 2.5 mM → 1 mM (n = 5). (I) Ano current detected in VMHAno4 neurons under different glucose fluctuation was blocked by Compound C (n = 5). (J and K) Firing frequency and resting membrane potential of VMHAno4 neurons in response to low glucose in the presence of AMPK blocker Compound C (10 μM) (n = 11). Data are expressed as mean ± SEM. Significant differences between 5 mM glucose and 1 mM glucose are shown as ****P < 0.0001 determined by a 2-tailed paired Student’s t test for B, C, F, G, J, and K and 2-way ANOVA followed by Bonferroni tests for E and H.

