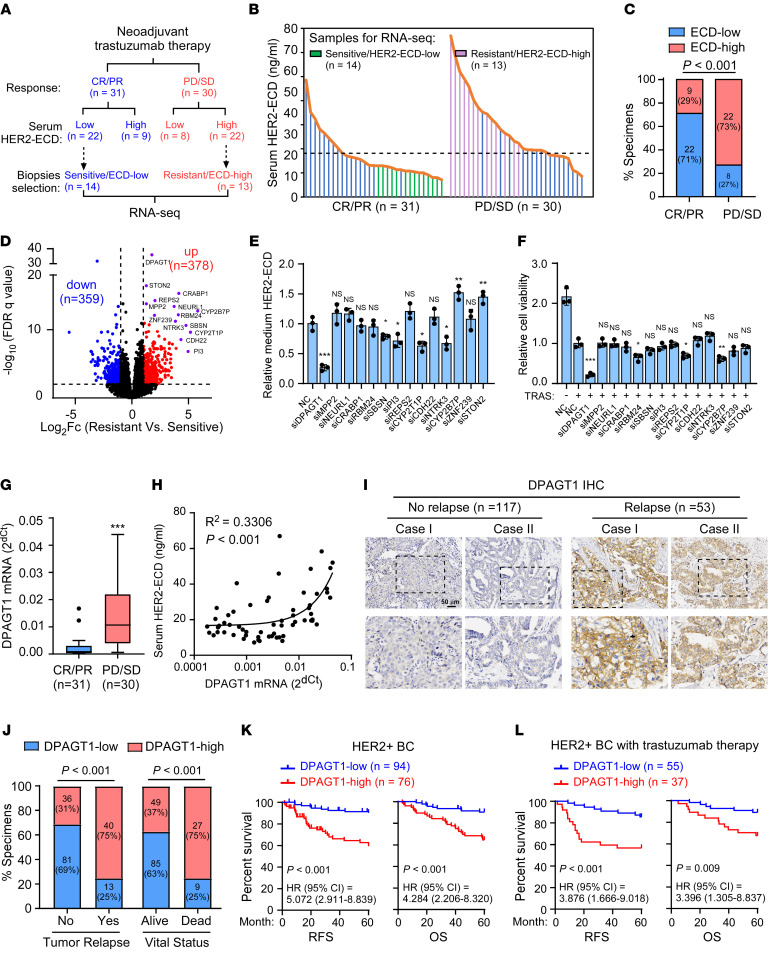
Figure 1. DPAGT1 is a potential regulator of HER2 shedding and correlates with poor prognosis.
(A) A schematic diagram showing the information regarding neoadjuvant trastuzumab therapy response and serum HER2-ECD expression in 61 patients. Tumor biopsies with trastuzumab-sensitive/ECD-low (n = 14) or trastuzumab-resistant/ECD-high (n = 13) were selected for RNA-Seq analysis. (B) ELISA analysis of HER2-ECD levels in the serum derived from HER2+ breast cancer patients before trastuzumab therapy. The data were log2 transformed and the median was used as the cutoff. The green and pink histograms indicated the samples selected for RNA-Seq. (C) Correlation analysis between serum HER2-ECD level and trastuzumab response. (D) Volcano plot showing the gene expression in RNA-Seq analysis in trastuzumab-resistant HER2+ breast cancer tissues compared with sensitive ones. FDR < 0.01 and fold change > 2 were used as the cutoff. (E) Histograms showing relative HER2-ECD level in the medium of NC- or the indicated siRNA-transfected SK-BR-3 cells. (F) Relative cell viability of NC- or the indicated siRNA-transfected SK-BR-3 cells upon trastuzumab treatment (20 μg/mL, 48 hours). (G) qRT-PCR analysis of DPAGT1 mRNA in the 61 HER2+ breast cancer patient biopsies. GAPDH was used as an internal control. (H) Linear regression analysis of the correlation between DPAGT1 mRNA expression in biopsies and HER2-ECD levels in patient serum. (I) Representative IHC staining images of DPAGT1 in HER2+ breast cancer specimens. Scale bar: 50 μm. (J) Correlation analysis between DPAGT1 expression, tumor relapse, and patient vital status. (K) Kaplan-Meier analysis of RFS (left) and OS (right) curves in HER2+breast cancer with low- or high-DPAGT1 expression (n = 170). HR, hazard ratio. (L) Kaplan-Meier curves of RFS (left) and OS (right) in the patient subgroup receiving trastuzumab therapy. Data in E and F are plotted as the mean ± SD of biological triplicates. Data in G are shown in a Tukey Boxplot. A χ2 test was used in C and J. An unpaired 2-sided Student’s t test was used in E–G. A Log-rank test was used in K–L. *P < 0.05, **P < 0.01, ***P < 0.001.

