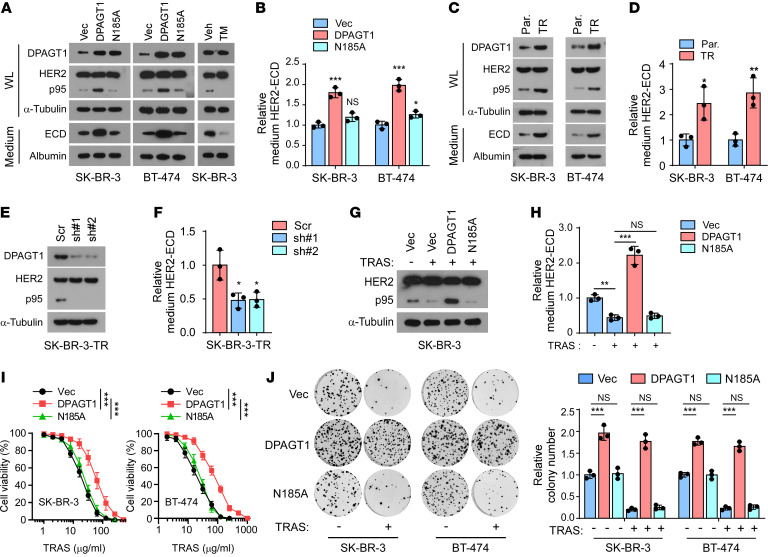
Figure 2. DPAGT1 induces HER2 shedding and trastuzumab resistance.
(A) IB analysis showing the expression of DPAGT1, HER2, and p95HER2 in the whole lysate (WL) and HER2-ECD in the medium. α-Tubulin was used as a loading control for the WL and Albumin was used as a loading control for proteins in the medium. (B) ELISA analysis of HER2-ECD levels in the medium from indicated cells. (C) IB analysis of expression of HER2 and p95HER2 in the whole lysate (WL) and the ECD level in condensed culture medium from the parental (Par.) and trastuzumab-resistant (TR) SK-BR-3 and BT-474 cells. (D) Relative HER2-ECD level in the medium from the parental and trastuzumab-resistant cells. (E) IB analysis of HER2 and p95HER2 expression in the indicated trastuzumab-resistant SK-BR-3 cells. α-Tubulin was used as a loading control. (F) Relative HER2-ECD level in the medium from control or DPAGT1-silenced trastuzumab-resistant SK-BR-3 cells. (G) IB analysis of HER2 and p95HER2 expression in the Vector-, DPAGT1-, or DPAGT1-N185A-transduced SK-BR-3 cells with or without trastuzumab treatment (20 μg/mL). α-Tubulin was used as a loading control. (H) Relative HER2-ECD level in the medium from indicated SK-BR-3 cells. (I) Cell viability assay analyzing the sensitivity of the indicated SK-BR-3 and BT-474 cells to trastuzumab treatment (20 μg/mL, 48 hours). (J) Representative image (left) and quantification (right) of surviving colonies formed by the indicated SK-BR-3 and BT-474 cells with or without trastuzumab treatment (20 μg/mL). Data in B, D, F, H, I, and J were plotted as the mean ± SD of biological triplicates. An unpaired 2-sided Student’s t test was used in B, D, F, H, and J. 2-way ANOVA was used in I. *P < 0.05, **P < 0.01, ***P < 0.001.

