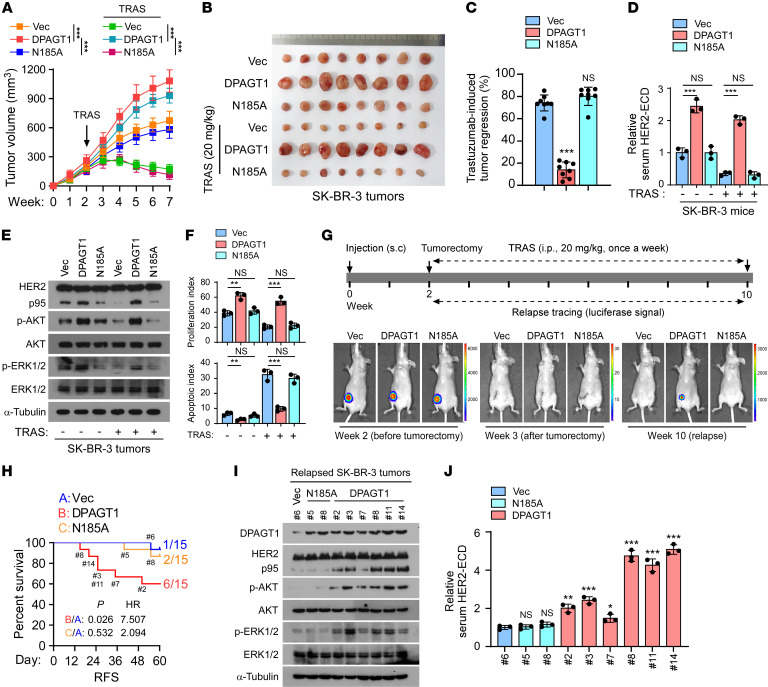
Figure 3. DPAGT1 promotes trastuzumab resistance by inducing HER2 shedding in vivo.
(A) Tumor growth curves of the xenograft tumors (n = 8/group) formed by Vector-, DPAGT1-, or DPAGT1/N185A-transduced SK-BR-3 cells. After 2 weeks of inoculation of the indicated cells, trastuzumab (20 mg/kg) was administrated once a week for 5 weeks. Tumor volumes were assayed weekly. (B) Representative pictures of xenograft tumors formed by the indicated cells treated with or without trastuzumab (20 mg/kg). (C) The tumor growth inhibition rate induced by trastuzumab in each group was calculated by the reduction in tumor volume after trastuzumab treatment relative to the tumor volume treated with IgG, using the formula (VIgG – VTRAS+) / VIgG. (D) ELISA analysis of HER2-ECD level in serum from the indicated mice. (E) IB analysis of the expression of p95HER2, p-AKT, AKT, p-ERK1/2, and ERK1/2 in the tumors formed by the indicated SK-BR-3 cells. (F) The proliferation index and apoptotic index, represented as the percentage of Ki67+ cells and TUNEL+ cells, in the tumors formed by the indicated SK-BR-3 cells. (G) A scheme showing the indicated s.c. tumor recurrence model with trastuzumab treatment. (H) Kaplan–Meier relapse-free survival of mice (n = 15/group) from the Figure 3G indicating the number of mice in each group recurring at the indicated time. HR, hazard ratio. (I) IB analysis of expression of p95HER2, p-AKT, AKT, p-ERK1/2, and ERK1/2 in the indicated recurrent tumors from each group. (J) ELISA analysis of the serum HER2-ECD level in the mice in each group. Data in A, C, D, F, and J were plotted as the mean ± SD of biological triplicates. Data in A and C was plotted as the means ± SD of 8 mice. Data in D was plotted as the mean ± SD of 3 mice. An unpaired 2-sided Student’s t test was used in C, D, and F. 2-way ANOVA was used in A. The log-rank test was used in H. *P < 0.05, **P < 0.01, ***P < 0.001.

