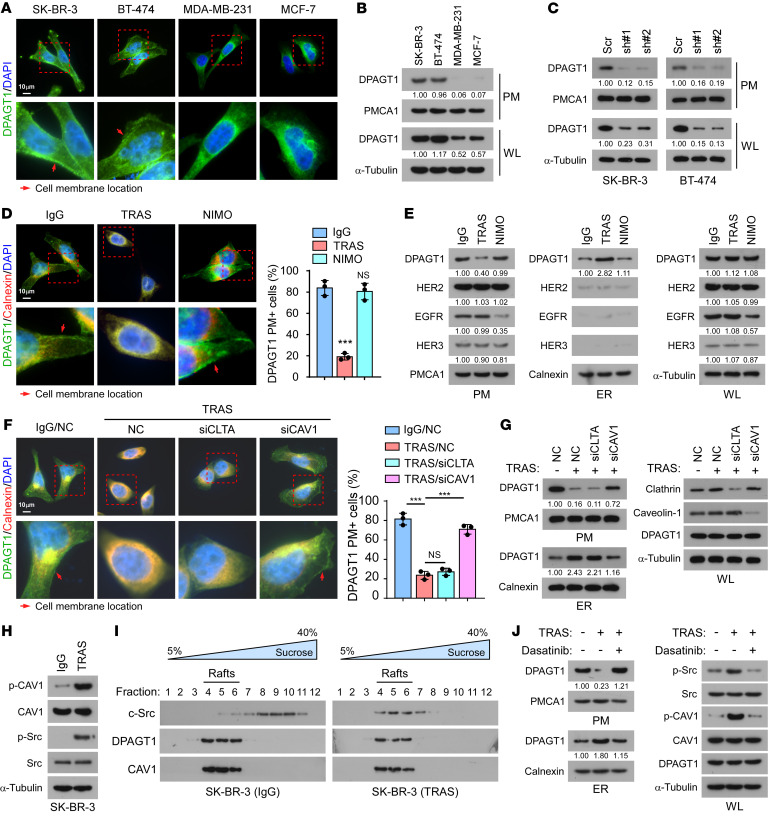
Figure 4. Trastuzumab induces retrograde transport of DPAGT1.
(A) Representative IF staining images of DPAGT1 and DAPI in the indicated cells. Red arrows indicate the location of the cell membrane. Scale bar: 10 μm (B and C) IB analysis of DPAGT1 expression in the extracted plasma membrane (PM) and whole lysate (WL) from SK-BR-3, BT-474, MDA-MB-231, and MCF-7 cells (B), or from Vector- or DPAGT1-silenced SK-BR-3 and BT-474 cells (C). PMCA1 was used as a PM marker. α-Tubulin was used as a loading control. (D) Representative IF staining images of DPAGT1 in SK-BR-3 cells treated with IgG, trastuzumab, or nimotuzumab (NIMO, 20 μg/mL). The percentage of DPAGT1 PM+ cells was quantified in 10 random fields. Scale bar: 10 μm (E) IB analysis of expression of DPAGT1, HER2, EGFR, and HER3 in the extracted PM, extracted ER, and WL of SK-BR-3 cells treated with IgG, trastuzumab, or nimotuzumab. Calnexin was used as an ER marker. PMCA1 was used as a PM marker. α-Tubulin was used as a loading control. (F) Representative IF staining image (left) and quantification (right) of DPAGT1 PM+ cells in the indicated cells. Scale bar: 10 μm (G) IB analysis of DPAGT1 expression in the extracted PM, extracted ER, and WL of indicated SK-BR-3 cells. Calnexin was used as an ER marker. PMCA1 was used as a PM marker. α-Tubulin was used as a loading control. (H) IB analysis of expression p-CAV1Y14, CAV1, p-c-SrcY416, and c-Src in IgG- or trastuzumab-treated SK-BR-3 cells. α-Tubulin was used as a loading control. (I) IB analysis of expression of DPAGT1, c-Src, and CAV1 in the lipid rafts isolated from IgG- or trastuzumab-treated SK-BR-3 cells. (J) IB analysis of DPAGT1 expression in the extracted PM and ER fractions from SK-BR-3 cells treated with IgG, trastuzumab, or trastuzumab + c-Src inhibitor Dasatinib (4 μM). Data in D and F were plotted as the mean ± SD of biological triplicates and analyzed with an unpaired 2-sided Student’s t test. The arrows in panels D and F indicate plasma membrane expression. Relative protein expression was quantified by Image J. *P < 0.05, **P < 0.01, ***P < 0.001.

