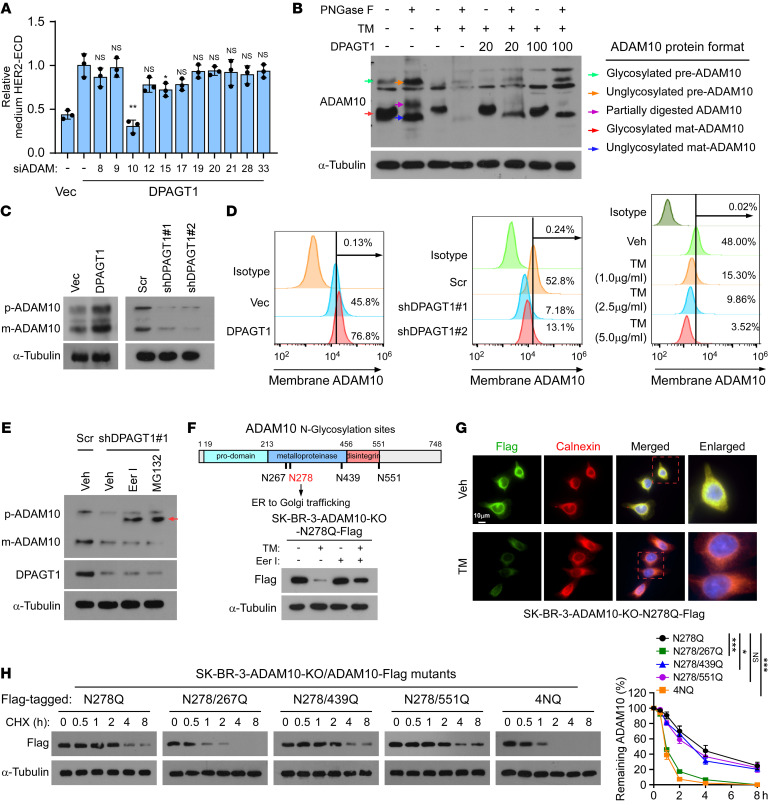
Figure 5. DPAGT1-mediated N-glycosylation protects ADAM10 from ER-associated degradation.
(A) ELISA analysis of HER2-ECD level in the culture medium derived from vector control or the indicated ADAM-silenced SK-BR-3 cells. (B) IB analysis of ADAM10 expression in SK-BR-3 cells treated with or without PNGase F, tunicamycin (TM), or DPAGT1 transfection. Arrows indicated different forms of the ADAM10 protein. α-Tubulin was used as a loading control. (C) IB analysis of ADAM10 expression in the control or DPAGT1-dysregulated SK-BR-3 cells. α-Tubulin was used as a loading control. (D) Flow cytometry analysis of membrane expression of ADAM10 in the indicated SK-BR-3 cells. (E) IB analysis of ADAM10 and DPAGT1 expression in the indicated SK-BR-3 cells treated with vehicle, Eeyarestatin I (Eer I, 20 μM), or MG132 (10 μM). Arrow indicates the unglycosylated ADAM10 precursor. α-Tubulin was used as a loading control. (F) Upper: a scheme indicating the 4 N-glycosylation sites of ADAM10. Lower: IB analysis of ADAM10/N278Q-Flag expression in the SK-BR-3/ADAM10-KO cells treated with Vehicle, TM, Eer I, or TM + Eer I. (G) IF staining of flag-tagged ADAM10/N278Q and ER marker Calnexin in the vehicle- or TM-treated ADAM10/N278Q-Flag-transduced SK-BR-3/ADAM10-KO cells. (H) Cycloheximide (CHX) chase assay analysis of expression of the indicated ADAM10-Flag mutants (N278Q, 4NQ, N278/267Q, N278/439Q, and N278/551Q) in the indicated SK-BR-3-ADAM10-KO cells treated with 100 μg/ml CHX. Proteins were collected at the indicated time points and then immunoblotted with an anti-Flag antibody. Quantification of Flag-ADAM10 protein level was determined by normalization to α-tubulin protein. Data in (A and H) were plotted as the mean ± SD of biological triplicates. A 2-sided Student’s t test was used in A and 2-way ANOVA was used in H. *P < 0.05, **P < 0.01, ***P < 0.001.

