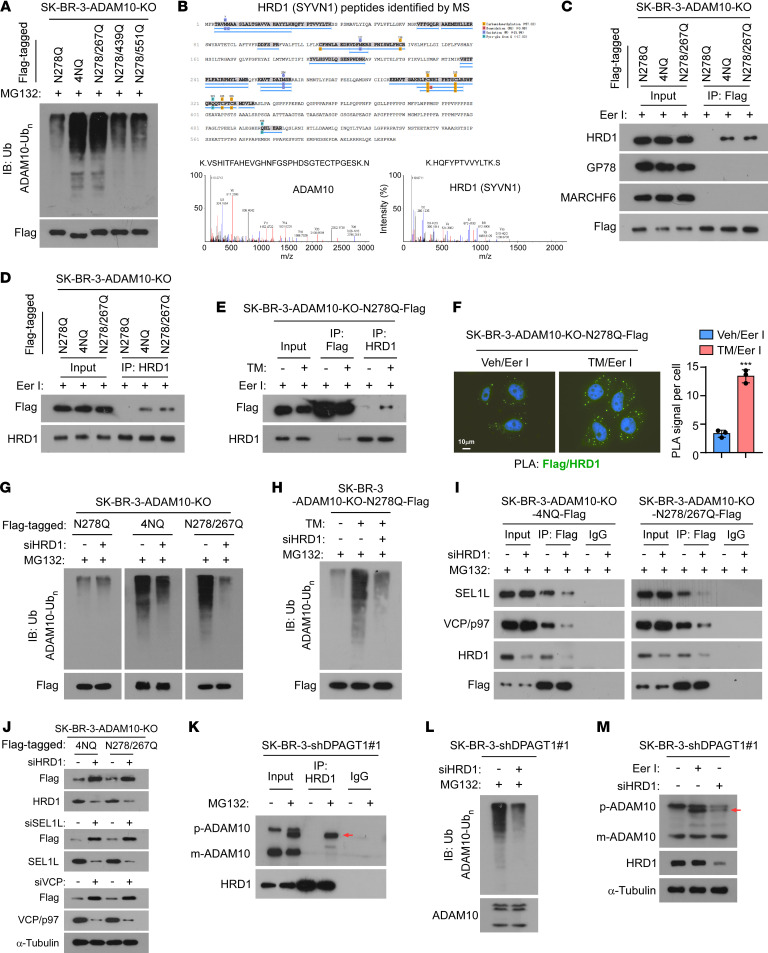
Figure 6. Unglycosylated ADAM10 is degraded by the HRD1/SEL1L/VCP complex.
(A) IB analysis of poly-Ub expression of the indicated Flag-tagged ADAM10 mutants in the cells. α-Tubulin was used as a loading control. (B) IP/MS analysis showing ADAM10 and HRD1 (SYVN1) protein peptides in the ADAM10/4NQ-Flag complex precipitated from the Eer I-treated SK-BR-3/ADAM10-KO cells. (C) Co-IP assays using anti-Flag antibody were performed in the indicated cells, and IB analysis of the expression of HRD1, GP78, MARCHF6, and Flag-tagged ADAM10 mutants were shown. (D) IP/IB analysis of HRD1 and Flag-tagged ADAM10 mutants in the indicated SK-BR-3 cells. (E) IP/IB analysis of HRD1 and Flag-tagged ADAM10/N278Q in the indicated cells. (F) Proximity ligation assay (PLA) analysis of the interaction between ADAM10-N278Q-Flag and HRD1 upon Eer I or Eer I + TM treatment. The PLA signal was quantified by counting the foci in 5 random fields per cell. Scale bar: 10 μm. 2-sided Student’s t test was used. Data were plotted as the mean ± SD of biological triplicates. ***P < 0.001. (G and H) IB analysis of poly-Ub expression of the indicated Flag-tagged ADAM10 mutants in the indicated cells treated with MG132 (G) or MG132 + TM (H). (I) IP/IB analysis of the expression of SEL1L, VCP/p97, HRD1, and Flag-tagged ADAM10 mutants in the indicated cells. α-Tubulin was used as a loading control. (J) IB analysis of the expression of SEL1L, VCP/p97, HRD1, and Flag-tagged ADAM10 mutants in the indicated cells. α-Tubulin was used as a loading control. (K) IP/IB analysis of the levels of precursor ADAM10 (p-ADAM10), mature ADAM10 (m-ADAM10), and HRD1 in the indicated cells. Arrow indicates the unglycosylated ADAM10 precursor. (L) IB analysis of the poly Ubiquitination expression of ADAM10 in the control or HRD1-silenced SK-BR-3/ shDPAGT1-#1 cells. (M) IB analysis of expression of p-ADAM10, m-ADAM10 and HRD1 in the indicated cells. Arrow indicates the unglycosylated ADAM10 precursor. α-Tubulin was used as the loading control.

