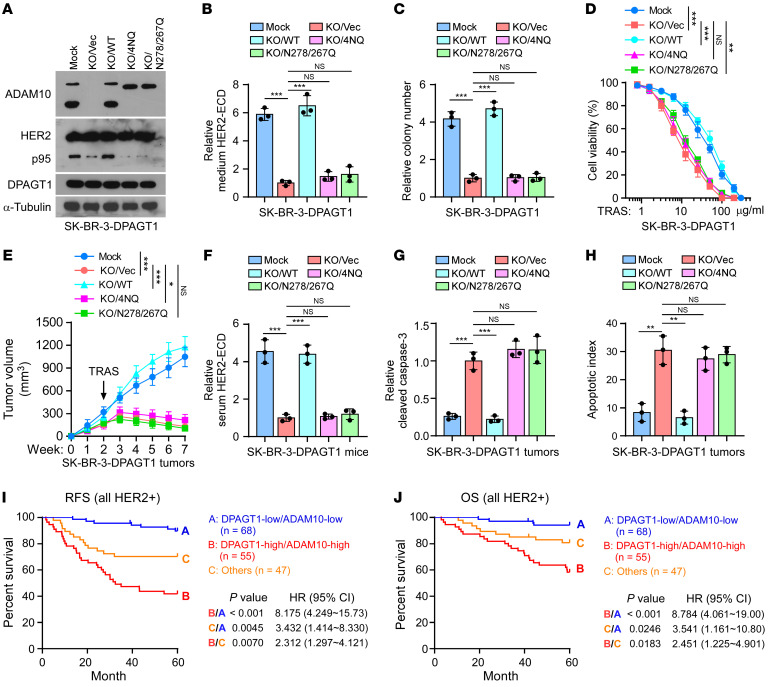
Figure 7. N-glycosylation of ADAM10 is required for DPAGT1-induced trastuzumab resistance.
(A) IB analysis of the expression of ADAM10, p95, and DPAGT1 in the indicated cells. Mock represents the SK-BR-3/DPAGT1 cells. α-Tubulin was used as a loading control. (B) ELISA analysis of HER2-ECD level in the culture medium from the same cells in A. Data are presented relative to that in the KO/Vec cells. (C) Quantification of relative surviving colonies formed by indicated cells. Data are presented relative to that in the KO/Vec cells. (D) Cell viability assays analyzed the sensitivities of the indicated cells to trastuzumab. (E) Tumor growth curves of the xenograft tumors (n = 8/group) formed by the indicated cells. After 2 weeks of inoculation of the indicated cells, trastuzumab (20 mg/kg) was administered once a week for 5 weeks. Tumor volumes were measured weekly. (F) Relative serum HER2-ECD level in 3 mice from each group. (G) ELISA analysis of relative cleaved caspase-3 in indicated tumors. (H) The apoptotic index represented as the percentage of TUNEL+ cells in indicated tumors. (I and J) Kaplan-Meier analysis of RFS (I) and OS (J) curves in the patients with HER2+ breast cancer stratified by DPAGT1-high/ADAM10-high, DPAGT1-low/ADAM10-low, and others. Data in B, C, D, G, H, and I were plotted as the mean ± SD of biological triplicates. Data in E was plotted as the mean ± SD of 8 mice. Unpaired 2-sided Student’s t test was used in B, C, G, H, and I. 2-way ANOVA was used in D and E. χ2 test was used in J. *P < 0.05, **P < 0.01, ***P < 0.001.

