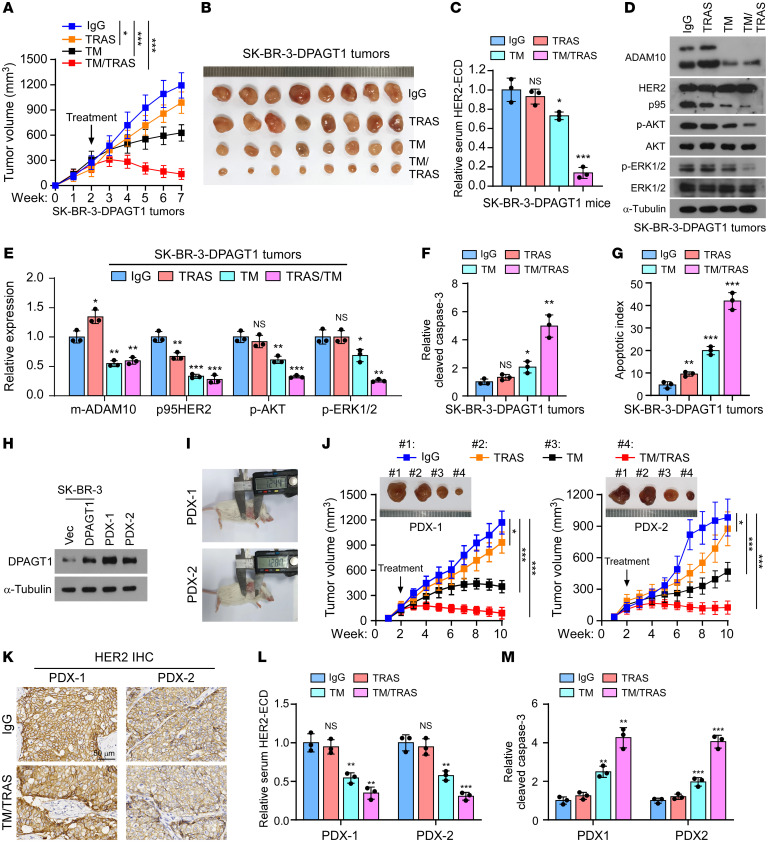
Figure 8. Inhibition of DPAGT1 re-sensitizes trastuzumab-resistant breast cancer.
(A and B) Tumor growth curves (A) and representative pictures (B) of the xenograft tumors (n = 8/group) formed with SK-BR-3/DPAGT1 cells in the mice, which, after 2 weeks of inoculation of the indicated cells, were administered with IgG, trastuzumab (i.p.), TM (i.t.), or TM + trastuzumab once a week for 5 weeks. Tumor volumes were measured weekly. (C) ELISA analysis of the serum HER2-ECD level in the mice in each group. (D and E) IB analysis (D) and relative quantification (E) of the expression of ADAM10, HER2, p-AKT, AKT, p-ERK1/2, and ERK1/2 in the homogenates prepared from 3 random tumors in each group. (F) ELISA assay of the relative cleaved caspase-3 in the indicated tumors. (G) The apoptotic index represented as the percentage of TUNEL+ cells in the indicated tumors. (H) IB analysis of DPAGT1 expression in SK-BR-3/Vector and SK-BR-3/DPAGT1cells and in PDX-1 and -2. (I) Representative image of PDX-1 and PDX-2 tumor-bearing mice treated with IgG. (J) Representative pictures (upper) and tumor growth curves (lower) of PDX-1 and PDX-2 tumor-bearing mice with indicated treatment. n = 8/group. (K) IHC staining of HER2 in PDX-1 and PDX-2 tumor-bearing mice treated with IgG or TM + trastuzumab. Scale bar: 50 μm. (L) ELISA analysis of the serum HER2-ECD level in 3 mice in each group. (M) ELISA analysis of relative cleaved caspase-3 in the indicated PDXs. Data in C, F, G, L, and M were plotted as the mean ± SD of biological triplicates. Data in A and J were plotted as the mean ± SD of 8 mice. Unpaired 2-sided Student’s t test was used in C, E–G, L, and M. 2-way ANOVA was used in A and J. *P < 0.05, **P < 0.01, ***P < 0.001.

