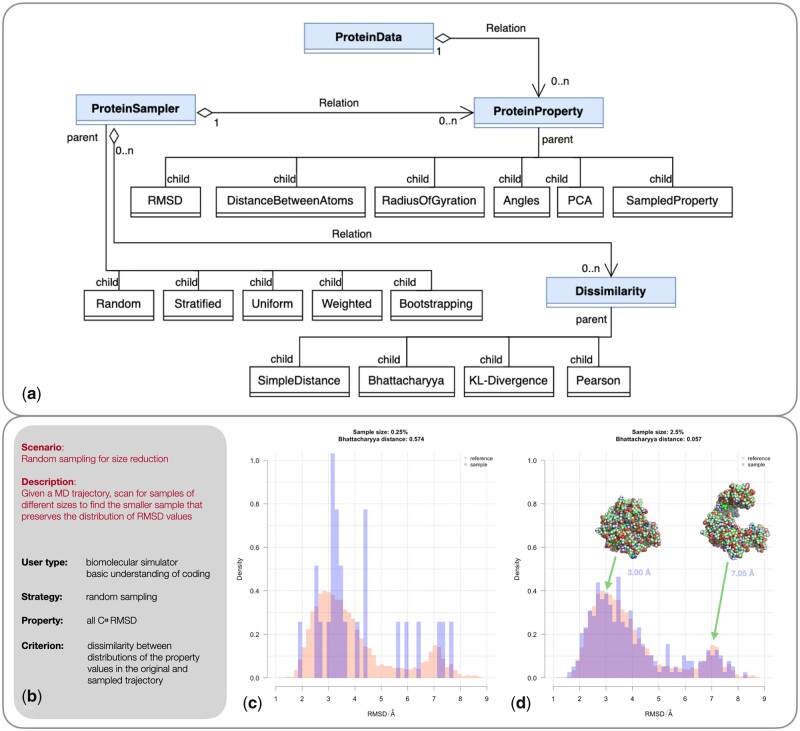
Figure 1.
(a) Class diagram of MDSubsampler library illustrating the relationships between main classes (filled blue rectangles) and subclasses (white rectangles). The diagram depicts the multiplicity between main classes (shown as relation), where symbols indicate the number of instances of one class linked to the ones of another class, with 1 meaning exactly 1 instance, and 0.n meaning many instances. (b) Summary description of an example scenario (random sampling for size reduction) where different subsample sizes are extracted with the aim of preserving the information in the distribution of values for a reference property. (c and d) Comparison of the distributions of Root Mean Square Deviation (RMSD) over the coordinates of all Cα atoms in the original and subsampled trajectory for sample sizes of 0.25% and 2.5% (see Supplementary Fig. S2 for a larger range of sample sizes). The distance between the sampled and original distributions was calculated using Bhattacharyya distance: 0.574 (for 0.25%) and 0.057 (for 2.5%). A subset of 2.5% is the smallest sample for which the shape and peak’s location of the distribution of RMSD is preserved (see Supplementary Fig. S2). Example structures for an open and close conformations of adenylate kinase are reported in the top right of panel d. Distribution plots were generated with R (R Core Team 2022) and protein structure images with PyMol (Schrödinger LLC 2015).

