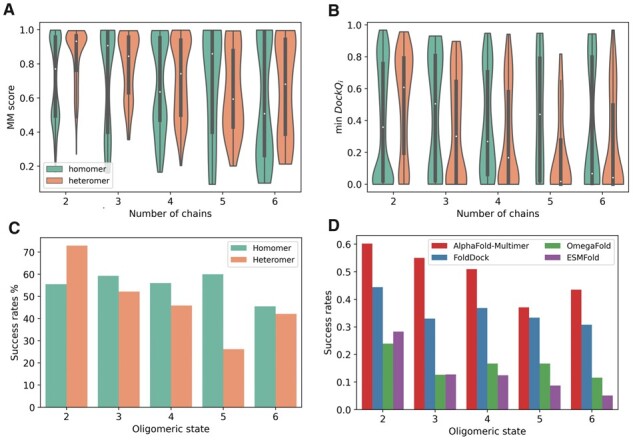
Figure 5.

Performance comparison for different oligomeric states. (A and B) AlphaFold-Multimer performance using (A) min DockQi and MM-score per complex between homomers and heteromers. The white dot represents the median, while the thick grey bar in the centre represents the interquartile range. The ‘violin shape’ shows a kernel density estimation of the data. (C) Success rates (i.e. the fraction of acceptable models with min DockQi > 0.23) for AlphaFold-Multimer predictions. (D) Success rates on the common subset (n = 837) of the benchmark dataset using AlphaFold-Multimer, FoldDock, OmegaFold, and ESMFold. The common subset comprises 592 dimers, 103 trimers, 110 tetramers, 6 pentamers, and 26 hexamers.
