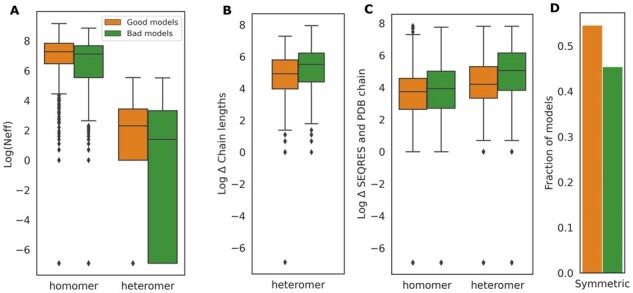
Figure 6.

Comparison between models with (min DockQi >0.23 and MM-score > 0.75, referred as ‘good models’ and coloured in orange) and models with (min DockQi < 0.23 and MM-score < 0.75, referred as ‘bad models’ and coloured in green) using (A) Log of the number of effective sequences (Neff)—small differences observed (P-value = 9 × 10⁻⁴ for heteromers; P-value = 1.4 × 10⁻³ for homomers). (B) Differences in length of chains within a heteromer—significant differences (P-value = 1.75 × 10⁻⁶). (C) Differences between SEQRES (model) and PDB ATOM sequence (native)—significant differences observed (P-value = 1.70 × 10⁻³⁰ for heteromers; P-value = 7.362 × 10⁻⁶ for homomers). (D) For symmetric protein complexes, the fraction of ‘good models’ and ‘bad models’.
