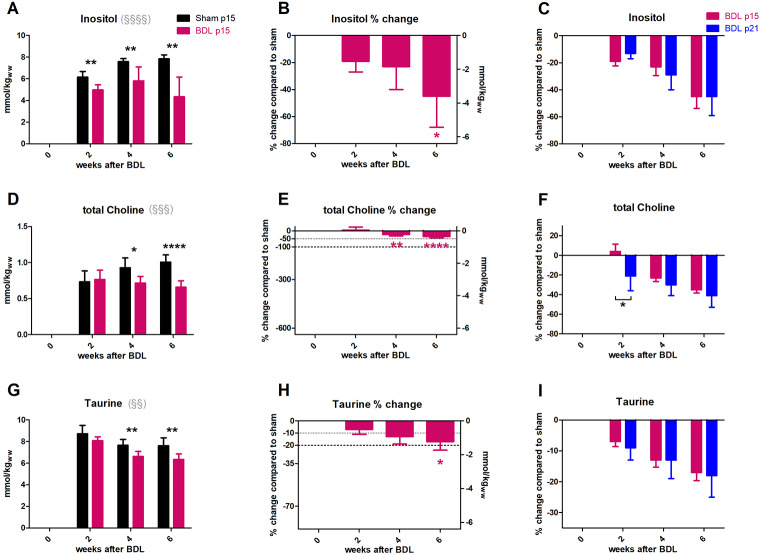
Fig. 4.
Evolution of brain organic osmolytes. (A, D, G) Absolute concentration in mmol/kgww in p15 BDL (pink) and sham (black). (B,E,H) Percental change in p15 BDL compared to sham at corresponding age. (C,F,I) Comparison between percental change in p15 BDL (pink) and in p21 BDL (blue) compared to their sham at corresponding age. *(pink) is compared to change at week 2; § indicates significant change in sham animals due to ongoing brain development in agreement with (Račkayová et al. 2021). Note: the scale of right y-axis in the middle column in mmol/kgww is set at the same range for all metabolites. This is for better visual comparison of their contribution to the osmoregulation.

