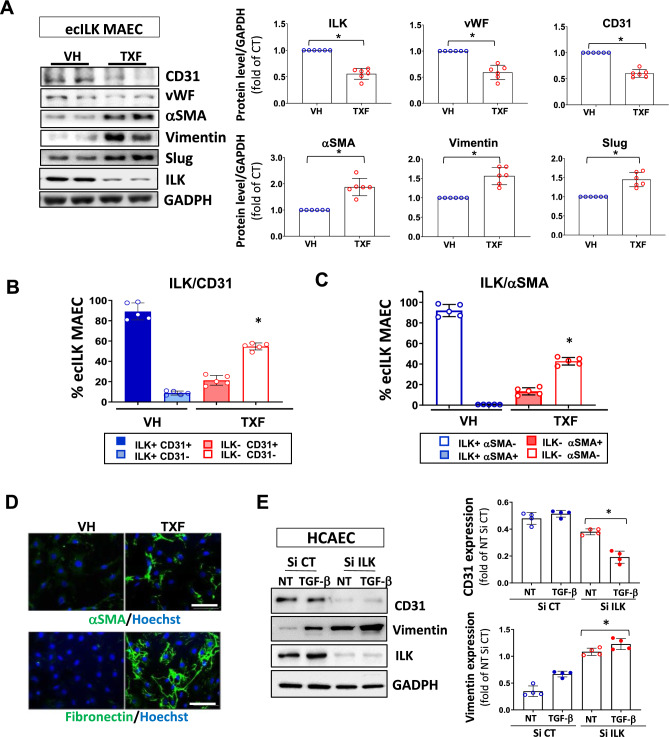
Fig. 8.
ILK deletion triggers endMT in ecILK MAEC and human coronary endothelial cells. A Western blot detection of endothelial (CD31 and vWF) and mesenchymal markers (αSMA and vimentin) expression, Slug and ILK in mouse aortic endothelial cells isolated from Cadh5-PAC-CRE ERT2/ILK flox mice (ecILK MAEC). ILK deletion was induced by treating the cells with Tamoxifen (10—6 M) (TXF) or vehicle (VH) for three days. GAPDH protein expression was used as loading control. In the right panel the quantitative analysis shows a significant decrease of ILK, vWF and CD31 in TXF ecILK MAEC as compared to VH (*p < 0.05, n = 6) and a significant increase in a-SMA, Vimentin and Slug (*p < 0.05, n = 6). Flow cytometry analysis of B endothelial marker CD31 and ILK and C ILK and α-SMA in VH and TXF treated ecILK MAEC. Figures represent the percentage of cells positive to each marker. VH-treated endothelial cells express CD31 and no α-SMA, whilst half of the TXF treated ecILK cells lose CD31 expression (ILK-,CD31-) whilst they become positive for α-SMA (ILK-, α-SMA +) (n = 5). *p < 0.01 vs CT. D Representative confocal microphotographs from VH and TXF ecILK MAEC stained for α-SMA (upper panel) or Fibronectin (lower panel). Nuclei were counterstained with Hoechst (blue). Scale bar: 10 μm. E Human coronary endothelial cells (HCAEC) were transfected with ILK-specific siRNA (si-ILK) or non-silencing siRNA scramble (si CT) and then, treated with 2 ng/ml TGFβ for 3 days. NT: non-treated. Left panel shows a representative immunoblot for the endothelial cell marker, CD31 and the mesenchymal cell marker, vimentin. GADPH protein expression is used as a loading control. Quantitative analysis (right panel) shows a significant reduction in CD31 expression when ILK was silenced which was further decreased after TGF-β treatment. Vimentin expression was increased in si-ILK cells, and further enhance after TGF- b treatment (*p < 0.05, n = 4) Blue circles: SiRNA CT/Red circles: SiRNA ILK. Empty: non-treated, filled: TGF-β treated.*p < 0.05 vs SiCT. p values were calculated using ANOVA

