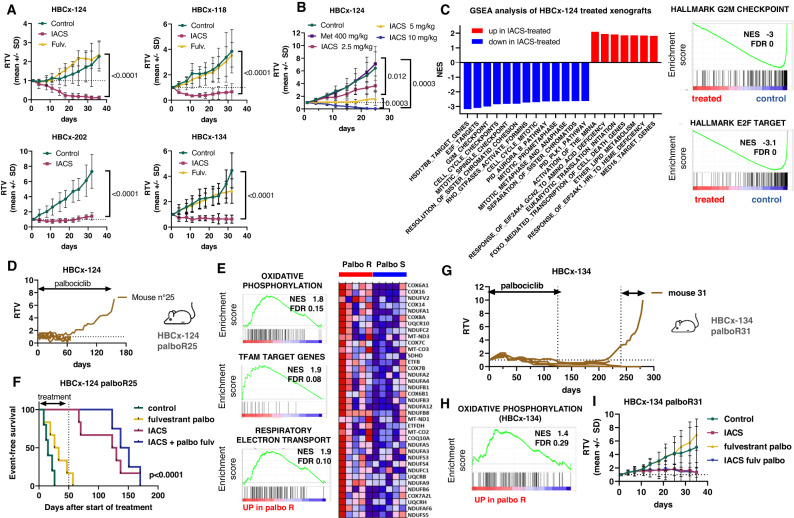
Fig. 2. Energy metabolism in BM PDX and OXPHOS targeting.
A In vivo response to IACS-010759 treatment in PDX of ER + BM. Mean ± SD. HBCx-124: n = 3 mice (control) and 4 mice (IACS and fulvestrant). HBCx-118: n = 4 mice/group. HBCx-202: n = 6 mice/group. HBCx-134 n = 5 mice (control and IACS) and n = 8 mice (fulvestrant). P values were calculated with the Mann–Whitney test (two-tailed). B Response of HBCx-124 to different doses of IACS-010759 and to metformin (n = 7 mice/group) P values were calculated with the Mann–Whitney test (two-tailed). C GSEA analysis of HBCx-124 xenografts after 1 week of IACS treatment. D Establishment of the palbociclib-resistant HBCx-124 palboR25 PDX model. E Enrichment plots of oxidative phosphorylation, TFAM target genes and respiratory electron transport hallmarks from the GSEA enrichment analysis of HBCx-124 palboR25 PDX as compared to the parental palbo responder (palbo S) HBCx-124. NES normalised enrichment score. FDR false discovery rate. Oxidative phosphorylation heatmap. F Kaplan–Meier survival analysis of HBCx-124 palboR25 PDX treated by fulvestrant and palbociclib, IACS-010759 and the combination of palbociclib + fulvestrant and IACS-010759 n = 6 mice (control), n = 7 mice (fulv palbo and IACS, n = 5 mice (IACS + palbo fulv). Log-rank (Mantel–Cox) test. G Establishment of the palbociclib-resistant HBCx-134 palboR31 PDX model. H Enrichment plots of oxidative phosphorylation, NES normalised enrichment score, FDR false discovery rate. Oxidative phosphorylation heatmap. I Response to IACS, fulvestrant and palbo and IACS + fulvestrant and palbo in the HBCx-134 palbo31 PDX. n = 4 mice (control), n = 5 mice (IACS, palbo fulv), n = 6 mice (IACS + palbo fulv). Mean ± SD. RTV relative tumour volume. Source data are provided as a Source Data file. n number of mice.

